Immigrants from Argentina vs Ottawa Single Mother Poverty
COMPARE
Immigrants from Argentina
Ottawa
Single Mother Poverty
Single Mother Poverty Comparison
Immigrants from Argentina
Ottawa
27.1%
SINGLE MOTHER POVERTY
99.7/ 100
METRIC RATING
51st/ 347
METRIC RANK
35.5%
SINGLE MOTHER POVERTY
0.0/ 100
METRIC RATING
324th/ 347
METRIC RANK
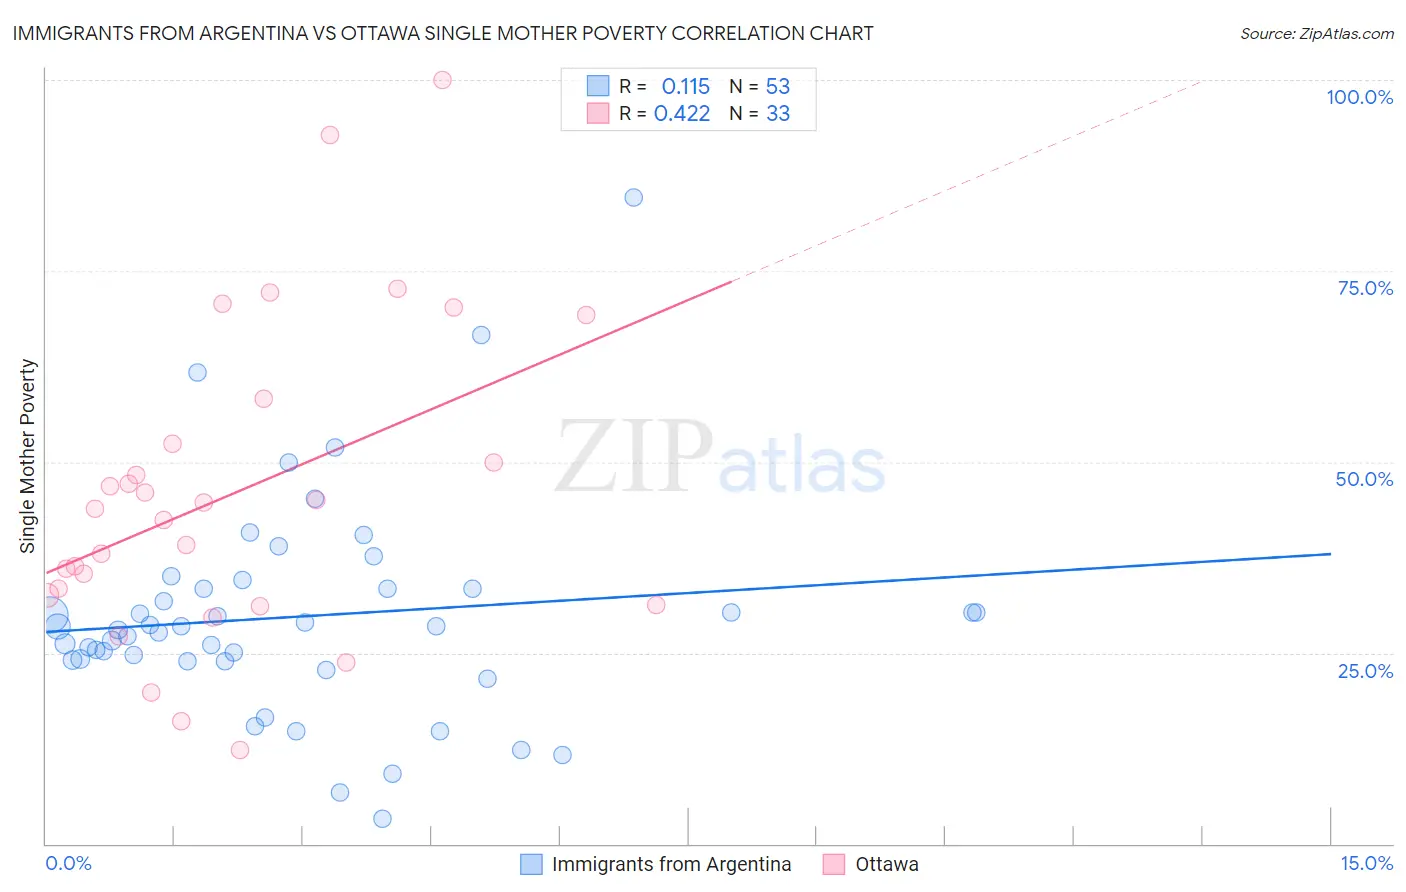
Immigrants from Argentina vs Ottawa Single Mother Poverty Correlation Chart
The statistical analysis conducted on geographies consisting of 259,658,600 people shows a poor positive correlation between the proportion of Immigrants from Argentina and poverty level among single mothers in the United States with a correlation coefficient (R) of 0.115 and weighted average of 27.1%. Similarly, the statistical analysis conducted on geographies consisting of 49,602,464 people shows a moderate positive correlation between the proportion of Ottawa and poverty level among single mothers in the United States with a correlation coefficient (R) of 0.422 and weighted average of 35.5%, a difference of 31.1%.
Single Mother Poverty Correlation Summary
| Measurement | Immigrants from Argentina | Ottawa |
| Minimum | 3.3% | 12.2% |
| Maximum | 84.6% | 100.0% |
| Range | 81.3% | 87.8% |
| Mean | 29.7% | 45.9% |
| Median | 28.5% | 43.8% |
| Interquartile 25% (IQ1) | 24.0% | 31.9% |
| Interquartile 75% (IQ3) | 33.3% | 55.3% |
| Interquartile Range (IQR) | 9.3% | 23.5% |
| Standard Deviation (Sample) | 14.2% | 20.6% |
| Standard Deviation (Population) | 14.1% | 20.3% |
Similar Demographics by Single Mother Poverty
Demographics Similar to Immigrants from Argentina by Single Mother Poverty
In terms of single mother poverty, the demographic groups most similar to Immigrants from Argentina are Immigrants from South Eastern Asia (27.1%, a difference of 0.040%), Immigrants from Jordan (27.1%, a difference of 0.080%), Immigrants from Bulgaria (27.1%, a difference of 0.11%), Immigrants from Egypt (27.1%, a difference of 0.14%), and Immigrants from Romania (27.2%, a difference of 0.19%).
| Demographics | Rating | Rank | Single Mother Poverty |
| Immigrants | Sierra Leone | 99.9 /100 | #44 | Exceptional 26.9% |
| Latvians | 99.9 /100 | #45 | Exceptional 26.9% |
| Immigrants | Serbia | 99.9 /100 | #46 | Exceptional 26.9% |
| Egyptians | 99.8 /100 | #47 | Exceptional 26.9% |
| Immigrants | Poland | 99.8 /100 | #48 | Exceptional 26.9% |
| Cambodians | 99.8 /100 | #49 | Exceptional 27.0% |
| Laotians | 99.8 /100 | #50 | Exceptional 27.0% |
| Immigrants | Argentina | 99.7 /100 | #51 | Exceptional 27.1% |
| Immigrants | South Eastern Asia | 99.7 /100 | #52 | Exceptional 27.1% |
| Immigrants | Jordan | 99.7 /100 | #53 | Exceptional 27.1% |
| Immigrants | Bulgaria | 99.7 /100 | #54 | Exceptional 27.1% |
| Immigrants | Egypt | 99.7 /100 | #55 | Exceptional 27.1% |
| Immigrants | Romania | 99.7 /100 | #56 | Exceptional 27.2% |
| Palestinians | 99.7 /100 | #57 | Exceptional 27.2% |
| Argentineans | 99.6 /100 | #58 | Exceptional 27.2% |
Demographics Similar to Ottawa by Single Mother Poverty
In terms of single mother poverty, the demographic groups most similar to Ottawa are Kiowa (35.5%, a difference of 0.21%), Ute (35.7%, a difference of 0.48%), Seminole (35.8%, a difference of 0.78%), Black/African American (35.2%, a difference of 0.92%), and Paiute (35.1%, a difference of 1.1%).
| Demographics | Rating | Rank | Single Mother Poverty |
| Cherokee | 0.0 /100 | #317 | Tragic 34.5% |
| Immigrants | Honduras | 0.0 /100 | #318 | Tragic 34.7% |
| Chippewa | 0.0 /100 | #319 | Tragic 34.8% |
| Iroquois | 0.0 /100 | #320 | Tragic 34.8% |
| Paiute | 0.0 /100 | #321 | Tragic 35.1% |
| Blacks/African Americans | 0.0 /100 | #322 | Tragic 35.2% |
| Kiowa | 0.0 /100 | #323 | Tragic 35.5% |
| Ottawa | 0.0 /100 | #324 | Tragic 35.5% |
| Ute | 0.0 /100 | #325 | Tragic 35.7% |
| Seminole | 0.0 /100 | #326 | Tragic 35.8% |
| Yakama | 0.0 /100 | #327 | Tragic 36.4% |
| Choctaw | 0.0 /100 | #328 | Tragic 36.4% |
| Apache | 0.0 /100 | #329 | Tragic 36.6% |
| Natives/Alaskans | 0.0 /100 | #330 | Tragic 36.6% |
| Creek | 0.0 /100 | #331 | Tragic 36.7% |