Immigrants from Central America vs Ottawa Single Mother Poverty
COMPARE
Immigrants from Central America
Ottawa
Single Mother Poverty
Single Mother Poverty Comparison
Immigrants from Central America
Ottawa
33.6%
SINGLE MOTHER POVERTY
0.0/ 100
METRIC RATING
305th/ 347
METRIC RANK
35.5%
SINGLE MOTHER POVERTY
0.0/ 100
METRIC RATING
324th/ 347
METRIC RANK
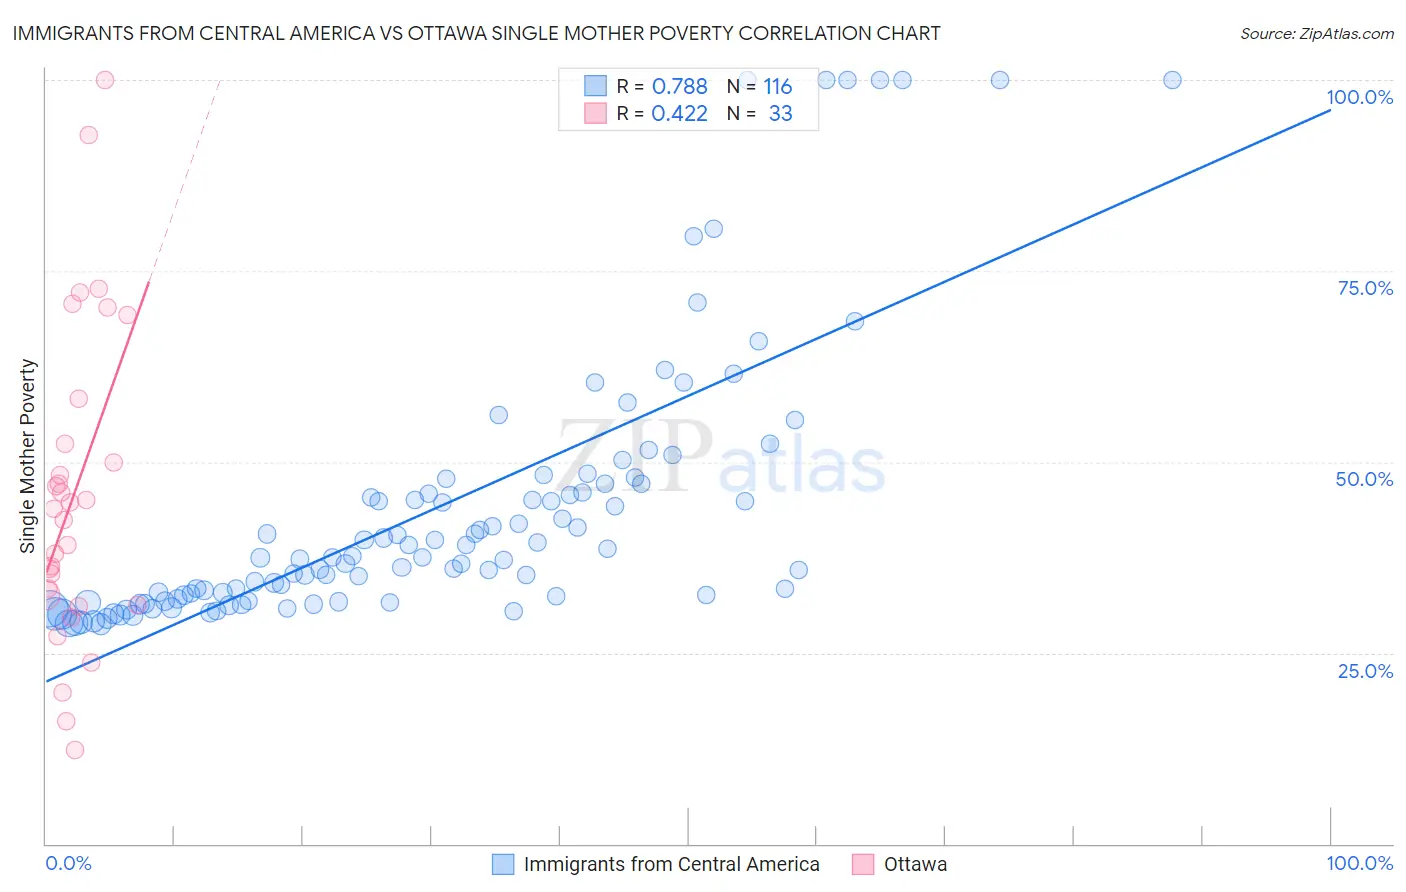
Immigrants from Central America vs Ottawa Single Mother Poverty Correlation Chart
The statistical analysis conducted on geographies consisting of 516,841,574 people shows a strong positive correlation between the proportion of Immigrants from Central America and poverty level among single mothers in the United States with a correlation coefficient (R) of 0.788 and weighted average of 33.6%. Similarly, the statistical analysis conducted on geographies consisting of 49,602,464 people shows a moderate positive correlation between the proportion of Ottawa and poverty level among single mothers in the United States with a correlation coefficient (R) of 0.422 and weighted average of 35.5%, a difference of 5.9%.
Single Mother Poverty Correlation Summary
| Measurement | Immigrants from Central America | Ottawa |
| Minimum | 28.8% | 12.2% |
| Maximum | 100.0% | 100.0% |
| Range | 71.2% | 87.8% |
| Mean | 43.8% | 45.9% |
| Median | 37.4% | 43.8% |
| Interquartile 25% (IQ1) | 31.9% | 31.9% |
| Interquartile 75% (IQ3) | 46.6% | 55.3% |
| Interquartile Range (IQR) | 14.7% | 23.5% |
| Standard Deviation (Sample) | 17.8% | 20.6% |
| Standard Deviation (Population) | 17.8% | 20.3% |
Demographics Similar to Immigrants from Central America and Ottawa by Single Mother Poverty
In terms of single mother poverty, the demographic groups most similar to Immigrants from Central America are Mexican (33.6%, a difference of 0.040%), Immigrants from Congo (33.8%, a difference of 0.64%), Comanche (33.9%, a difference of 1.1%), Immigrants from Mexico (34.0%, a difference of 1.2%), and Potawatomi (34.1%, a difference of 1.7%). Similarly, the demographic groups most similar to Ottawa are Kiowa (35.5%, a difference of 0.21%), Black/African American (35.2%, a difference of 0.92%), Paiute (35.1%, a difference of 1.1%), Iroquois (34.8%, a difference of 2.0%), and Chippewa (34.8%, a difference of 2.2%).
| Demographics | Rating | Rank | Single Mother Poverty |
| Mexicans | 0.0 /100 | #304 | Tragic 33.6% |
| Immigrants | Central America | 0.0 /100 | #305 | Tragic 33.6% |
| Immigrants | Congo | 0.0 /100 | #306 | Tragic 33.8% |
| Comanche | 0.0 /100 | #307 | Tragic 33.9% |
| Immigrants | Mexico | 0.0 /100 | #308 | Tragic 34.0% |
| Potawatomi | 0.0 /100 | #309 | Tragic 34.1% |
| Hondurans | 0.0 /100 | #310 | Tragic 34.2% |
| Alsatians | 0.0 /100 | #311 | Tragic 34.3% |
| Central American Indians | 0.0 /100 | #312 | Tragic 34.3% |
| Immigrants | Dominican Republic | 0.0 /100 | #313 | Tragic 34.4% |
| Chickasaw | 0.0 /100 | #314 | Tragic 34.4% |
| Hopi | 0.0 /100 | #315 | Tragic 34.5% |
| Dominicans | 0.0 /100 | #316 | Tragic 34.5% |
| Cherokee | 0.0 /100 | #317 | Tragic 34.5% |
| Immigrants | Honduras | 0.0 /100 | #318 | Tragic 34.7% |
| Chippewa | 0.0 /100 | #319 | Tragic 34.8% |
| Iroquois | 0.0 /100 | #320 | Tragic 34.8% |
| Paiute | 0.0 /100 | #321 | Tragic 35.1% |
| Blacks/African Americans | 0.0 /100 | #322 | Tragic 35.2% |
| Kiowa | 0.0 /100 | #323 | Tragic 35.5% |
| Ottawa | 0.0 /100 | #324 | Tragic 35.5% |