Immigrants from Ireland vs New Zealander Seniors Poverty Over the Age of 65
COMPARE
Immigrants from Ireland
New Zealander
Seniors Poverty Over the Age of 65
Seniors Poverty Over the Age of 65 Comparison
Immigrants from Ireland
New Zealanders
10.0%
SENIORS POVERTY OVER THE AGE OF 65
97.5/ 100
METRIC RATING
79th/ 347
METRIC RANK
10.0%
SENIORS POVERTY OVER THE AGE OF 65
97.7/ 100
METRIC RATING
76th/ 347
METRIC RANK
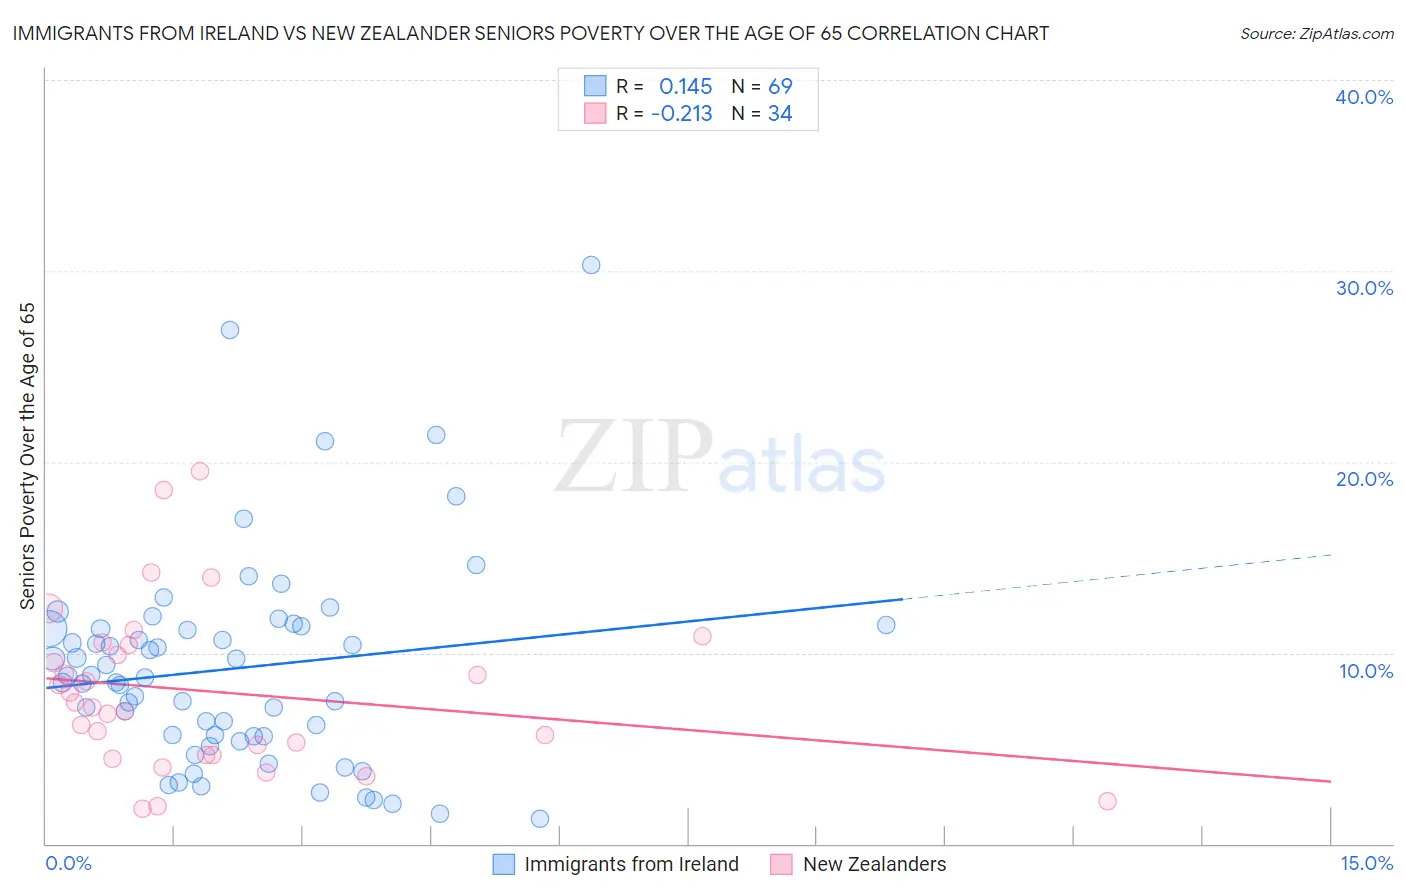
Immigrants from Ireland vs New Zealander Seniors Poverty Over the Age of 65 Correlation Chart
The statistical analysis conducted on geographies consisting of 240,436,919 people shows a poor positive correlation between the proportion of Immigrants from Ireland and poverty level among seniors over the age of 65 in the United States with a correlation coefficient (R) of 0.145 and weighted average of 10.0%. Similarly, the statistical analysis conducted on geographies consisting of 106,818,683 people shows a weak negative correlation between the proportion of New Zealanders and poverty level among seniors over the age of 65 in the United States with a correlation coefficient (R) of -0.213 and weighted average of 10.0%, a difference of 0.27%.
Seniors Poverty Over the Age of 65 Correlation Summary
| Measurement | Immigrants from Ireland | New Zealander |
| Minimum | 1.3% | 1.9% |
| Maximum | 30.3% | 19.5% |
| Range | 29.0% | 17.6% |
| Mean | 9.2% | 8.0% |
| Median | 8.7% | 7.3% |
| Interquartile 25% (IQ1) | 5.6% | 4.7% |
| Interquartile 75% (IQ3) | 11.3% | 10.4% |
| Interquartile Range (IQR) | 5.7% | 5.8% |
| Standard Deviation (Sample) | 5.5% | 4.3% |
| Standard Deviation (Population) | 5.4% | 4.2% |
Demographics Similar to Immigrants from Ireland and New Zealanders by Seniors Poverty Over the Age of 65
In terms of seniors poverty over the age of 65, the demographic groups most similar to Immigrants from Ireland are White/Caucasian (10.0%, a difference of 0.010%), Korean (10.1%, a difference of 0.10%), Immigrants from Sri Lanka (10.1%, a difference of 0.13%), Immigrants from Bolivia (10.1%, a difference of 0.20%), and Immigrants from Poland (10.1%, a difference of 0.22%). Similarly, the demographic groups most similar to New Zealanders are Immigrants from South Africa (10.0%, a difference of 0.020%), Immigrants from Czechoslovakia (10.0%, a difference of 0.050%), Turkish (10.0%, a difference of 0.14%), Russian (10.0%, a difference of 0.16%), and Palestinian (10.0%, a difference of 0.19%).
| Demographics | Rating | Rank | Seniors Poverty Over the Age of 65 |
| Immigrants | Austria | 98.6 /100 | #67 | Exceptional 9.9% |
| Canadians | 98.5 /100 | #68 | Exceptional 9.9% |
| Australians | 98.4 /100 | #69 | Exceptional 9.9% |
| Samoans | 98.0 /100 | #70 | Exceptional 10.0% |
| Yugoslavians | 97.9 /100 | #71 | Exceptional 10.0% |
| Palestinians | 97.9 /100 | #72 | Exceptional 10.0% |
| Russians | 97.9 /100 | #73 | Exceptional 10.0% |
| Turks | 97.9 /100 | #74 | Exceptional 10.0% |
| Immigrants | Czechoslovakia | 97.8 /100 | #75 | Exceptional 10.0% |
| New Zealanders | 97.7 /100 | #76 | Exceptional 10.0% |
| Immigrants | South Africa | 97.7 /100 | #77 | Exceptional 10.0% |
| Whites/Caucasians | 97.5 /100 | #78 | Exceptional 10.0% |
| Immigrants | Ireland | 97.5 /100 | #79 | Exceptional 10.0% |
| Koreans | 97.4 /100 | #80 | Exceptional 10.1% |
| Immigrants | Sri Lanka | 97.3 /100 | #81 | Exceptional 10.1% |
| Immigrants | Bolivia | 97.3 /100 | #82 | Exceptional 10.1% |
| Immigrants | Poland | 97.2 /100 | #83 | Exceptional 10.1% |
| Immigrants | Afghanistan | 97.2 /100 | #84 | Exceptional 10.1% |
| Immigrants | Nepal | 97.2 /100 | #85 | Exceptional 10.1% |
| Romanians | 97.2 /100 | #86 | Exceptional 10.1% |
| Burmese | 97.2 /100 | #87 | Exceptional 10.1% |