Immigrants from Ireland vs Asian Seniors Poverty Over the Age of 65
COMPARE
Immigrants from Ireland
Asian
Seniors Poverty Over the Age of 65
Seniors Poverty Over the Age of 65 Comparison
Immigrants from Ireland
Asians
10.0%
SENIORS POVERTY OVER THE AGE OF 65
97.5/ 100
METRIC RATING
79th/ 347
METRIC RANK
10.4%
SENIORS POVERTY OVER THE AGE OF 65
89.9/ 100
METRIC RATING
124th/ 347
METRIC RANK
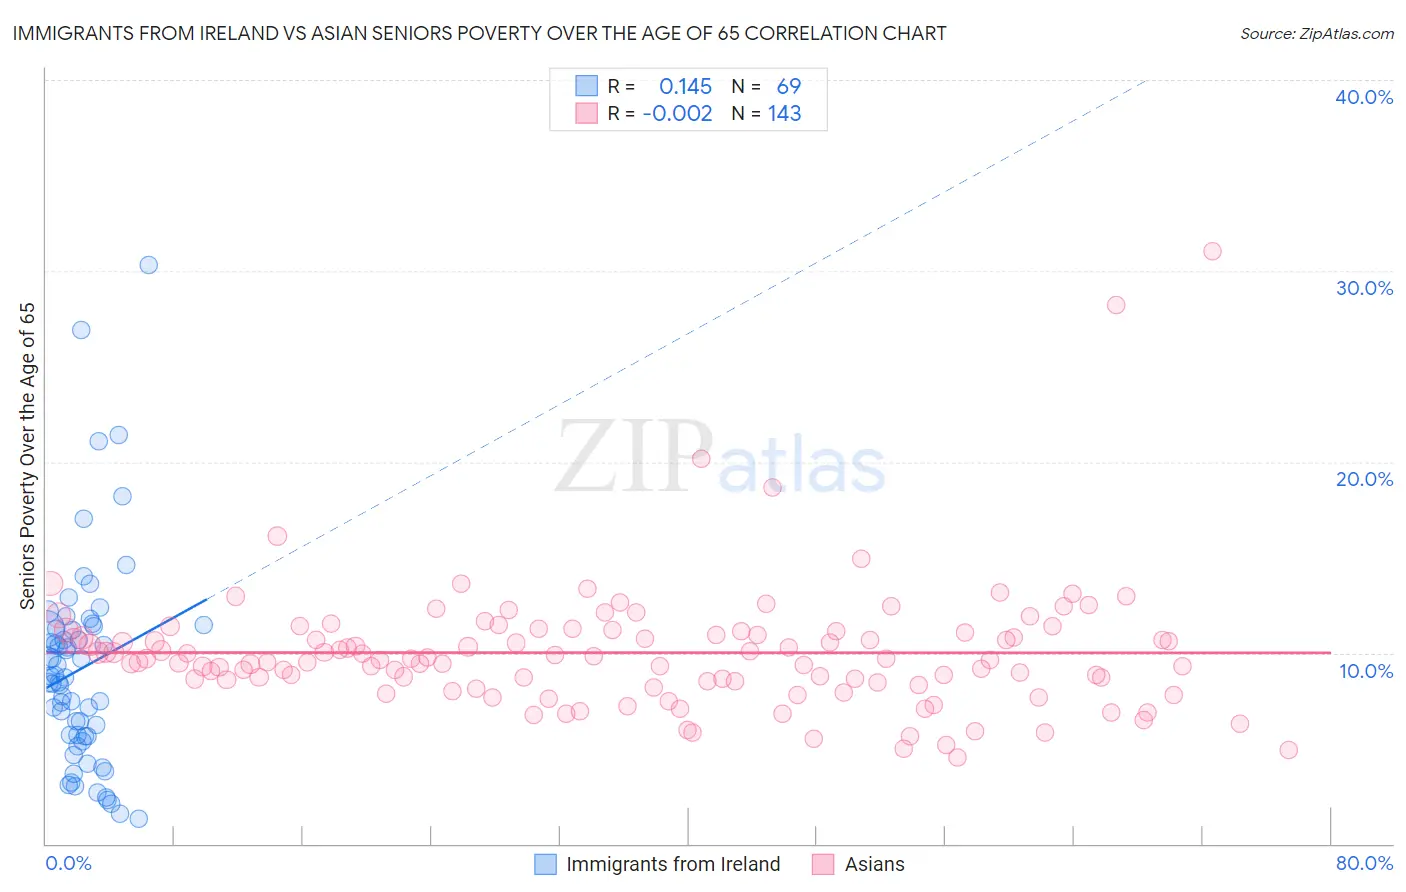
Immigrants from Ireland vs Asian Seniors Poverty Over the Age of 65 Correlation Chart
The statistical analysis conducted on geographies consisting of 240,436,919 people shows a poor positive correlation between the proportion of Immigrants from Ireland and poverty level among seniors over the age of 65 in the United States with a correlation coefficient (R) of 0.145 and weighted average of 10.0%. Similarly, the statistical analysis conducted on geographies consisting of 546,650,142 people shows no correlation between the proportion of Asians and poverty level among seniors over the age of 65 in the United States with a correlation coefficient (R) of -0.002 and weighted average of 10.4%, a difference of 3.5%.
Seniors Poverty Over the Age of 65 Correlation Summary
| Measurement | Immigrants from Ireland | Asian |
| Minimum | 1.3% | 4.5% |
| Maximum | 30.3% | 31.1% |
| Range | 29.0% | 26.5% |
| Mean | 9.2% | 10.0% |
| Median | 8.7% | 9.7% |
| Interquartile 25% (IQ1) | 5.6% | 8.5% |
| Interquartile 75% (IQ3) | 11.3% | 11.1% |
| Interquartile Range (IQR) | 5.7% | 2.6% |
| Standard Deviation (Sample) | 5.5% | 3.4% |
| Standard Deviation (Population) | 5.4% | 3.3% |
Similar Demographics by Seniors Poverty Over the Age of 65
Demographics Similar to Immigrants from Ireland by Seniors Poverty Over the Age of 65
In terms of seniors poverty over the age of 65, the demographic groups most similar to Immigrants from Ireland are White/Caucasian (10.0%, a difference of 0.010%), Korean (10.1%, a difference of 0.10%), Immigrants from Sri Lanka (10.1%, a difference of 0.13%), Immigrants from Bolivia (10.1%, a difference of 0.20%), and Immigrants from Poland (10.1%, a difference of 0.22%).
| Demographics | Rating | Rank | Seniors Poverty Over the Age of 65 |
| Palestinians | 97.9 /100 | #72 | Exceptional 10.0% |
| Russians | 97.9 /100 | #73 | Exceptional 10.0% |
| Turks | 97.9 /100 | #74 | Exceptional 10.0% |
| Immigrants | Czechoslovakia | 97.8 /100 | #75 | Exceptional 10.0% |
| New Zealanders | 97.7 /100 | #76 | Exceptional 10.0% |
| Immigrants | South Africa | 97.7 /100 | #77 | Exceptional 10.0% |
| Whites/Caucasians | 97.5 /100 | #78 | Exceptional 10.0% |
| Immigrants | Ireland | 97.5 /100 | #79 | Exceptional 10.0% |
| Koreans | 97.4 /100 | #80 | Exceptional 10.1% |
| Immigrants | Sri Lanka | 97.3 /100 | #81 | Exceptional 10.1% |
| Immigrants | Bolivia | 97.3 /100 | #82 | Exceptional 10.1% |
| Immigrants | Poland | 97.2 /100 | #83 | Exceptional 10.1% |
| Immigrants | Afghanistan | 97.2 /100 | #84 | Exceptional 10.1% |
| Immigrants | Nepal | 97.2 /100 | #85 | Exceptional 10.1% |
| Romanians | 97.2 /100 | #86 | Exceptional 10.1% |
Demographics Similar to Asians by Seniors Poverty Over the Age of 65
In terms of seniors poverty over the age of 65, the demographic groups most similar to Asians are Hmong (10.4%, a difference of 0.030%), Immigrants from Philippines (10.4%, a difference of 0.14%), Immigrants from Hungary (10.4%, a difference of 0.20%), Immigrants from Iraq (10.4%, a difference of 0.21%), and Immigrants from Moldova (10.4%, a difference of 0.21%).
| Demographics | Rating | Rank | Seniors Poverty Over the Age of 65 |
| Lebanese | 92.0 /100 | #117 | Exceptional 10.3% |
| Okinawans | 91.7 /100 | #118 | Exceptional 10.4% |
| Immigrants | Western Europe | 91.1 /100 | #119 | Exceptional 10.4% |
| Immigrants | Bosnia and Herzegovina | 90.8 /100 | #120 | Exceptional 10.4% |
| Immigrants | Iraq | 90.7 /100 | #121 | Exceptional 10.4% |
| Immigrants | Moldova | 90.7 /100 | #122 | Exceptional 10.4% |
| Hmong | 90.0 /100 | #123 | Exceptional 10.4% |
| Asians | 89.9 /100 | #124 | Excellent 10.4% |
| Immigrants | Philippines | 89.4 /100 | #125 | Excellent 10.4% |
| Immigrants | Hungary | 89.1 /100 | #126 | Excellent 10.4% |
| Cambodians | 89.1 /100 | #127 | Excellent 10.4% |
| Ottawa | 88.5 /100 | #128 | Excellent 10.4% |
| Immigrants | Iran | 88.4 /100 | #129 | Excellent 10.4% |
| Immigrants | Oceania | 88.4 /100 | #130 | Excellent 10.4% |
| Egyptians | 87.8 /100 | #131 | Excellent 10.5% |