Immigrants from Ireland vs Immigrants from Bosnia and Herzegovina Child Poverty Among Girls Under 16
COMPARE
Immigrants from Ireland
Immigrants from Bosnia and Herzegovina
Child Poverty Among Girls Under 16
Child Poverty Among Girls Under 16 Comparison
Immigrants from Ireland
Immigrants from Bosnia and Herzegovina
12.9%
CHILD POVERTY AMONG GIRLS UNDER 16
99.9/ 100
METRIC RATING
13th/ 347
METRIC RANK
16.8%
CHILD POVERTY AMONG GIRLS UNDER 16
32.5/ 100
METRIC RATING
189th/ 347
METRIC RANK
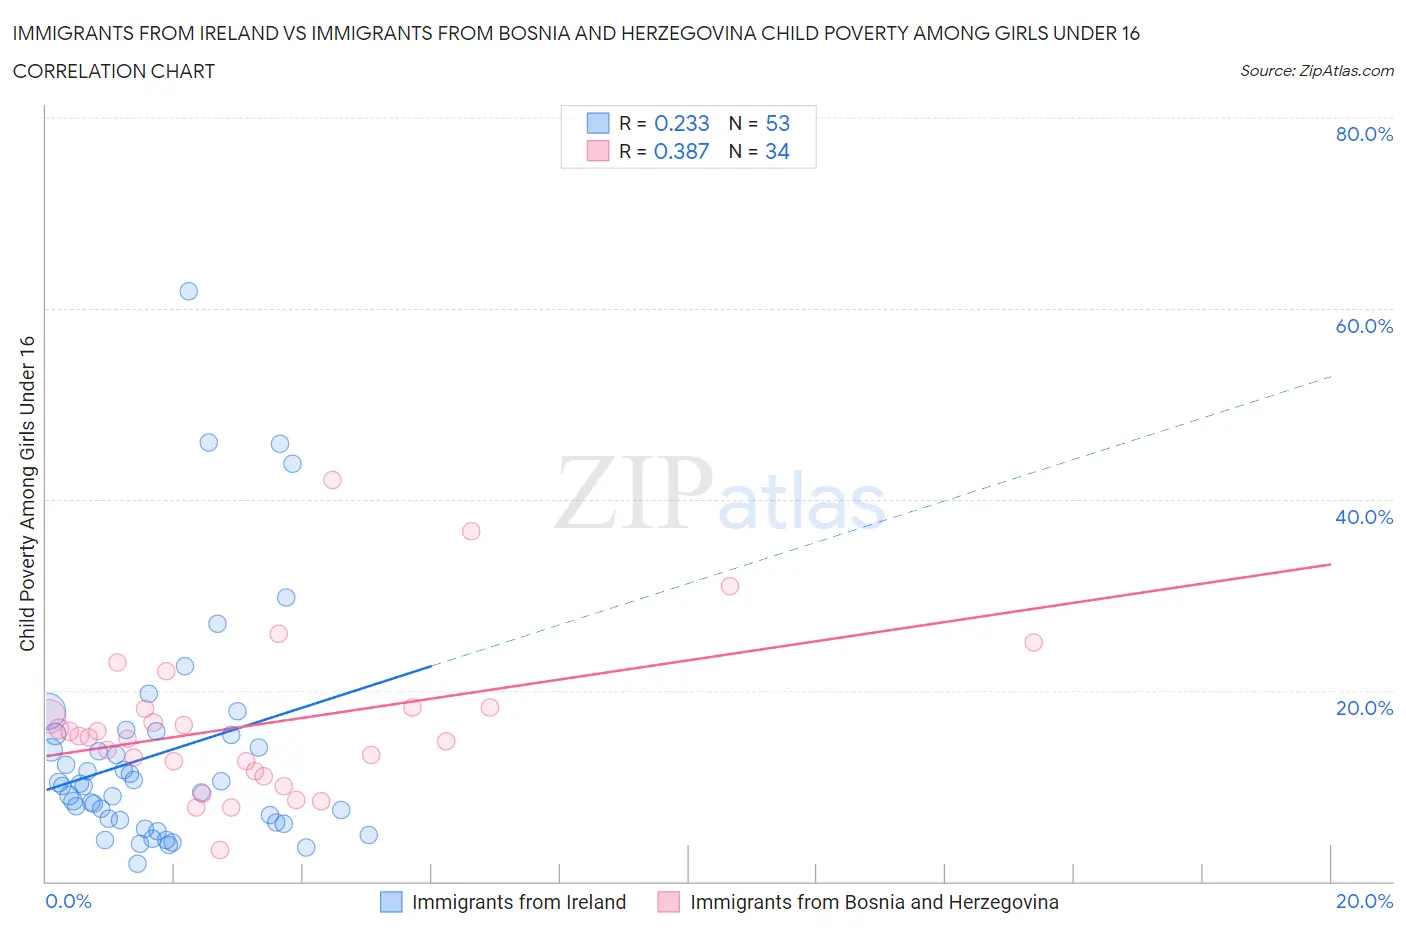
Immigrants from Ireland vs Immigrants from Bosnia and Herzegovina Child Poverty Among Girls Under 16 Correlation Chart
The statistical analysis conducted on geographies consisting of 236,323,145 people shows a weak positive correlation between the proportion of Immigrants from Ireland and poverty level among girls under the age of 16 in the United States with a correlation coefficient (R) of 0.233 and weighted average of 12.9%. Similarly, the statistical analysis conducted on geographies consisting of 155,792,725 people shows a mild positive correlation between the proportion of Immigrants from Bosnia and Herzegovina and poverty level among girls under the age of 16 in the United States with a correlation coefficient (R) of 0.387 and weighted average of 16.8%, a difference of 30.6%.
Child Poverty Among Girls Under 16 Correlation Summary
| Measurement | Immigrants from Ireland | Immigrants from Bosnia and Herzegovina |
| Minimum | 1.9% | 3.2% |
| Maximum | 61.8% | 42.0% |
| Range | 59.9% | 38.8% |
| Mean | 13.4% | 16.5% |
| Median | 10.0% | 15.1% |
| Interquartile 25% (IQ1) | 6.3% | 11.5% |
| Interquartile 75% (IQ3) | 15.3% | 18.2% |
| Interquartile Range (IQR) | 9.1% | 6.7% |
| Standard Deviation (Sample) | 12.0% | 8.1% |
| Standard Deviation (Population) | 11.9% | 8.0% |
Similar Demographics by Child Poverty Among Girls Under 16
Demographics Similar to Immigrants from Ireland by Child Poverty Among Girls Under 16
In terms of child poverty among girls under 16, the demographic groups most similar to Immigrants from Ireland are Bhutanese (12.7%, a difference of 1.0%), Burmese (13.0%, a difference of 1.1%), Okinawan (13.0%, a difference of 1.1%), Immigrants from South Central Asia (12.7%, a difference of 1.1%), and Immigrants from Lithuania (13.1%, a difference of 2.0%).
| Demographics | Rating | Rank | Child Poverty Among Girls Under 16 |
| Immigrants | Hong Kong | 100.0 /100 | #6 | Exceptional 12.3% |
| Chinese | 100.0 /100 | #7 | Exceptional 12.3% |
| Iranians | 100.0 /100 | #8 | Exceptional 12.4% |
| Immigrants | Singapore | 100.0 /100 | #9 | Exceptional 12.5% |
| Immigrants | Iran | 100.0 /100 | #10 | Exceptional 12.6% |
| Immigrants | South Central Asia | 100.0 /100 | #11 | Exceptional 12.7% |
| Bhutanese | 100.0 /100 | #12 | Exceptional 12.7% |
| Immigrants | Ireland | 99.9 /100 | #13 | Exceptional 12.9% |
| Burmese | 99.9 /100 | #14 | Exceptional 13.0% |
| Okinawans | 99.9 /100 | #15 | Exceptional 13.0% |
| Immigrants | Lithuania | 99.9 /100 | #16 | Exceptional 13.1% |
| Bulgarians | 99.9 /100 | #17 | Exceptional 13.1% |
| Immigrants | Korea | 99.9 /100 | #18 | Exceptional 13.1% |
| Cypriots | 99.9 /100 | #19 | Exceptional 13.2% |
| Immigrants | Japan | 99.9 /100 | #20 | Exceptional 13.3% |
Demographics Similar to Immigrants from Bosnia and Herzegovina by Child Poverty Among Girls Under 16
In terms of child poverty among girls under 16, the demographic groups most similar to Immigrants from Bosnia and Herzegovina are Kenyan (16.8%, a difference of 0.040%), Immigrants from the Azores (16.8%, a difference of 0.16%), Immigrants from Uganda (16.8%, a difference of 0.17%), Arab (16.8%, a difference of 0.25%), and Immigrants from Morocco (16.8%, a difference of 0.26%).
| Demographics | Rating | Rank | Child Poverty Among Girls Under 16 |
| Immigrants | Ethiopia | 43.1 /100 | #182 | Average 16.6% |
| Immigrants | Portugal | 42.5 /100 | #183 | Average 16.6% |
| Scotch-Irish | 39.6 /100 | #184 | Fair 16.7% |
| Immigrants | Uruguay | 35.6 /100 | #185 | Fair 16.7% |
| South American Indians | 35.0 /100 | #186 | Fair 16.8% |
| Immigrants | Morocco | 34.6 /100 | #187 | Fair 16.8% |
| Arabs | 34.5 /100 | #188 | Fair 16.8% |
| Immigrants | Bosnia and Herzegovina | 32.5 /100 | #189 | Fair 16.8% |
| Kenyans | 32.3 /100 | #190 | Fair 16.8% |
| Immigrants | Azores | 31.3 /100 | #191 | Fair 16.8% |
| Immigrants | Uganda | 31.3 /100 | #192 | Fair 16.8% |
| Aleuts | 28.7 /100 | #193 | Fair 16.9% |
| Spanish | 28.6 /100 | #194 | Fair 16.9% |
| Immigrants | Costa Rica | 25.6 /100 | #195 | Fair 17.0% |
| Celtics | 25.2 /100 | #196 | Fair 17.0% |