Immigrants from Ireland vs Immigrants from Bosnia and Herzegovina Median Family Income
COMPARE
Immigrants from Ireland
Immigrants from Bosnia and Herzegovina
Median Family Income
Median Family Income Comparison
Immigrants from Ireland
Immigrants from Bosnia and Herzegovina
$127,584
MEDIAN FAMILY INCOME
100.0/ 100
METRIC RATING
10th/ 347
METRIC RANK
$97,432
MEDIAN FAMILY INCOME
6.4/ 100
METRIC RATING
216th/ 347
METRIC RANK
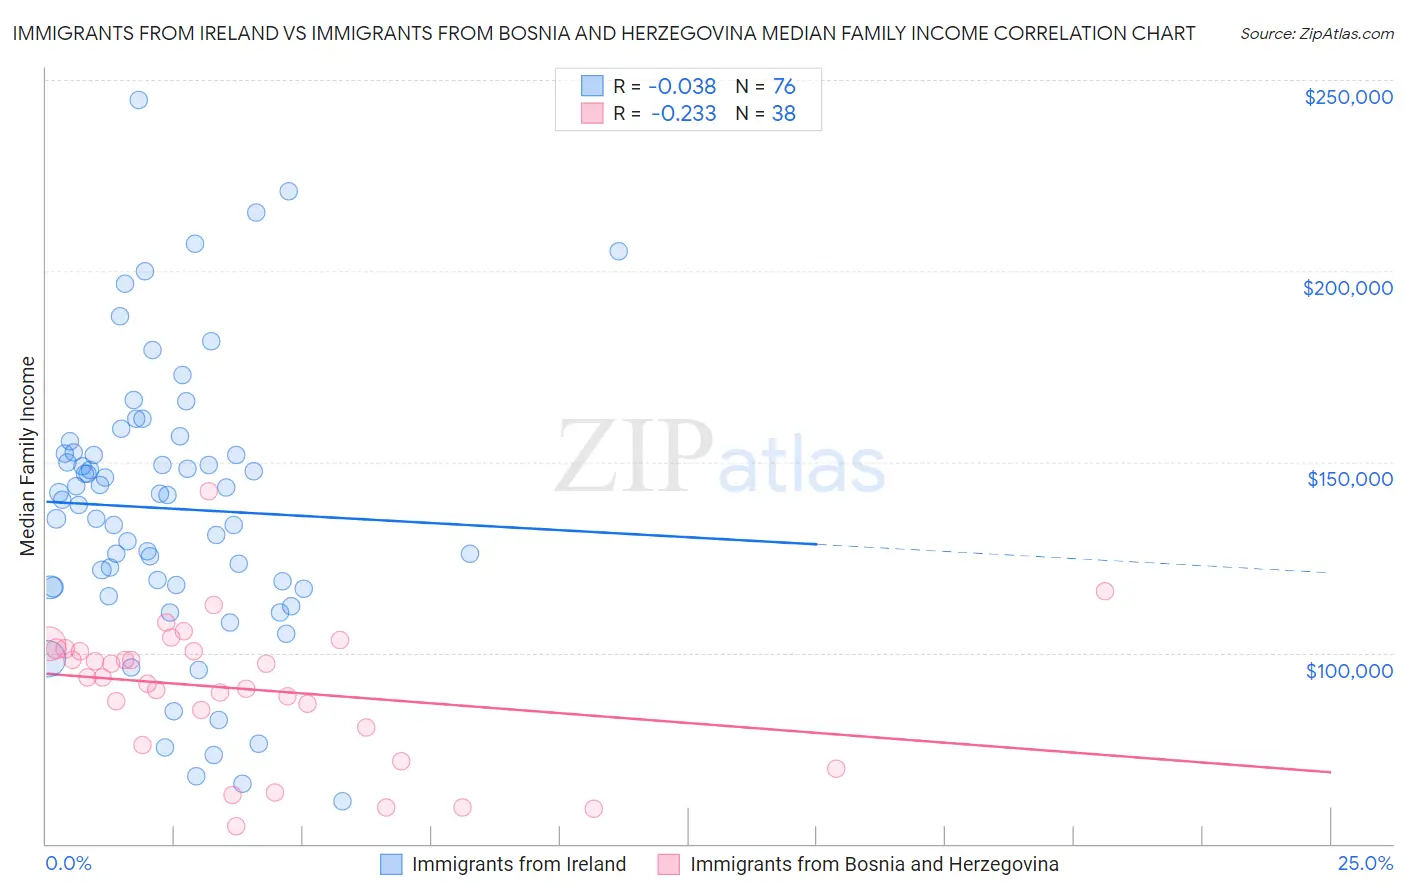
Immigrants from Ireland vs Immigrants from Bosnia and Herzegovina Median Family Income Correlation Chart
The statistical analysis conducted on geographies consisting of 240,734,590 people shows no correlation between the proportion of Immigrants from Ireland and median family income in the United States with a correlation coefficient (R) of -0.038 and weighted average of $127,584. Similarly, the statistical analysis conducted on geographies consisting of 156,800,946 people shows a weak negative correlation between the proportion of Immigrants from Bosnia and Herzegovina and median family income in the United States with a correlation coefficient (R) of -0.233 and weighted average of $97,432, a difference of 30.9%.
Median Family Income Correlation Summary
| Measurement | Immigrants from Ireland | Immigrants from Bosnia and Herzegovina |
| Minimum | $61,250 | $54,501 |
| Maximum | $244,785 | $142,183 |
| Range | $183,535 | $87,682 |
| Mean | $137,790 | $90,450 |
| Median | $140,594 | $93,519 |
| Interquartile 25% (IQ1) | $117,130 | $80,405 |
| Interquartile 75% (IQ3) | $152,367 | $100,969 |
| Interquartile Range (IQR) | $35,237 | $20,564 |
| Standard Deviation (Sample) | $36,818 | $18,350 |
| Standard Deviation (Population) | $36,575 | $18,107 |
Similar Demographics by Median Family Income
Demographics Similar to Immigrants from Ireland by Median Family Income
In terms of median family income, the demographic groups most similar to Immigrants from Ireland are Immigrants from Israel ($127,430, a difference of 0.12%), Cypriot ($127,064, a difference of 0.41%), Immigrants from Australia ($126,620, a difference of 0.76%), Immigrants from South Central Asia ($125,956, a difference of 1.3%), and Eastern European ($125,546, a difference of 1.6%).
| Demographics | Rating | Rank | Median Family Income |
| Immigrants | Singapore | 100.0 /100 | #3 | Exceptional $134,818 |
| Immigrants | India | 100.0 /100 | #4 | Exceptional $134,028 |
| Iranians | 100.0 /100 | #5 | Exceptional $133,839 |
| Thais | 100.0 /100 | #6 | Exceptional $131,281 |
| Immigrants | Hong Kong | 100.0 /100 | #7 | Exceptional $131,067 |
| Immigrants | Iran | 100.0 /100 | #8 | Exceptional $130,894 |
| Okinawans | 100.0 /100 | #9 | Exceptional $129,979 |
| Immigrants | Ireland | 100.0 /100 | #10 | Exceptional $127,584 |
| Immigrants | Israel | 100.0 /100 | #11 | Exceptional $127,430 |
| Cypriots | 100.0 /100 | #12 | Exceptional $127,064 |
| Immigrants | Australia | 100.0 /100 | #13 | Exceptional $126,620 |
| Immigrants | South Central Asia | 100.0 /100 | #14 | Exceptional $125,956 |
| Eastern Europeans | 100.0 /100 | #15 | Exceptional $125,546 |
| Immigrants | China | 100.0 /100 | #16 | Exceptional $125,540 |
| Indians (Asian) | 100.0 /100 | #17 | Exceptional $125,312 |
Demographics Similar to Immigrants from Bosnia and Herzegovina by Median Family Income
In terms of median family income, the demographic groups most similar to Immigrants from Bosnia and Herzegovina are Nigerian ($97,522, a difference of 0.090%), Bermudan ($97,577, a difference of 0.15%), Japanese ($97,288, a difference of 0.15%), Immigrants from Armenia ($97,605, a difference of 0.18%), and Immigrants from Cambodia ($97,222, a difference of 0.22%).
| Demographics | Rating | Rank | Median Family Income |
| Immigrants | Colombia | 8.7 /100 | #209 | Tragic $98,067 |
| Puget Sound Salish | 8.2 /100 | #210 | Tragic $97,958 |
| Immigrants | Sudan | 7.4 /100 | #211 | Tragic $97,737 |
| Panamanians | 7.2 /100 | #212 | Tragic $97,683 |
| Immigrants | Armenia | 7.0 /100 | #213 | Tragic $97,605 |
| Bermudans | 6.9 /100 | #214 | Tragic $97,577 |
| Nigerians | 6.7 /100 | #215 | Tragic $97,522 |
| Immigrants | Bosnia and Herzegovina | 6.4 /100 | #216 | Tragic $97,432 |
| Japanese | 6.0 /100 | #217 | Tragic $97,288 |
| Immigrants | Cambodia | 5.8 /100 | #218 | Tragic $97,222 |
| Delaware | 5.1 /100 | #219 | Tragic $96,958 |
| Sudanese | 4.7 /100 | #220 | Tragic $96,783 |
| Immigrants | Ghana | 4.2 /100 | #221 | Tragic $96,544 |
| Immigrants | Nigeria | 4.0 /100 | #222 | Tragic $96,439 |
| Venezuelans | 3.7 /100 | #223 | Tragic $96,281 |