Immigrants from Costa Rica vs Asian Seniors Poverty Over the Age of 65
COMPARE
Immigrants from Costa Rica
Asian
Seniors Poverty Over the Age of 65
Seniors Poverty Over the Age of 65 Comparison
Immigrants from Costa Rica
Asians
11.8%
SENIORS POVERTY OVER THE AGE OF 65
2.7/ 100
METRIC RATING
228th/ 347
METRIC RANK
10.4%
SENIORS POVERTY OVER THE AGE OF 65
89.9/ 100
METRIC RATING
124th/ 347
METRIC RANK
Immigrants from Costa Rica vs Asian Seniors Poverty Over the Age of 65 Correlation Chart
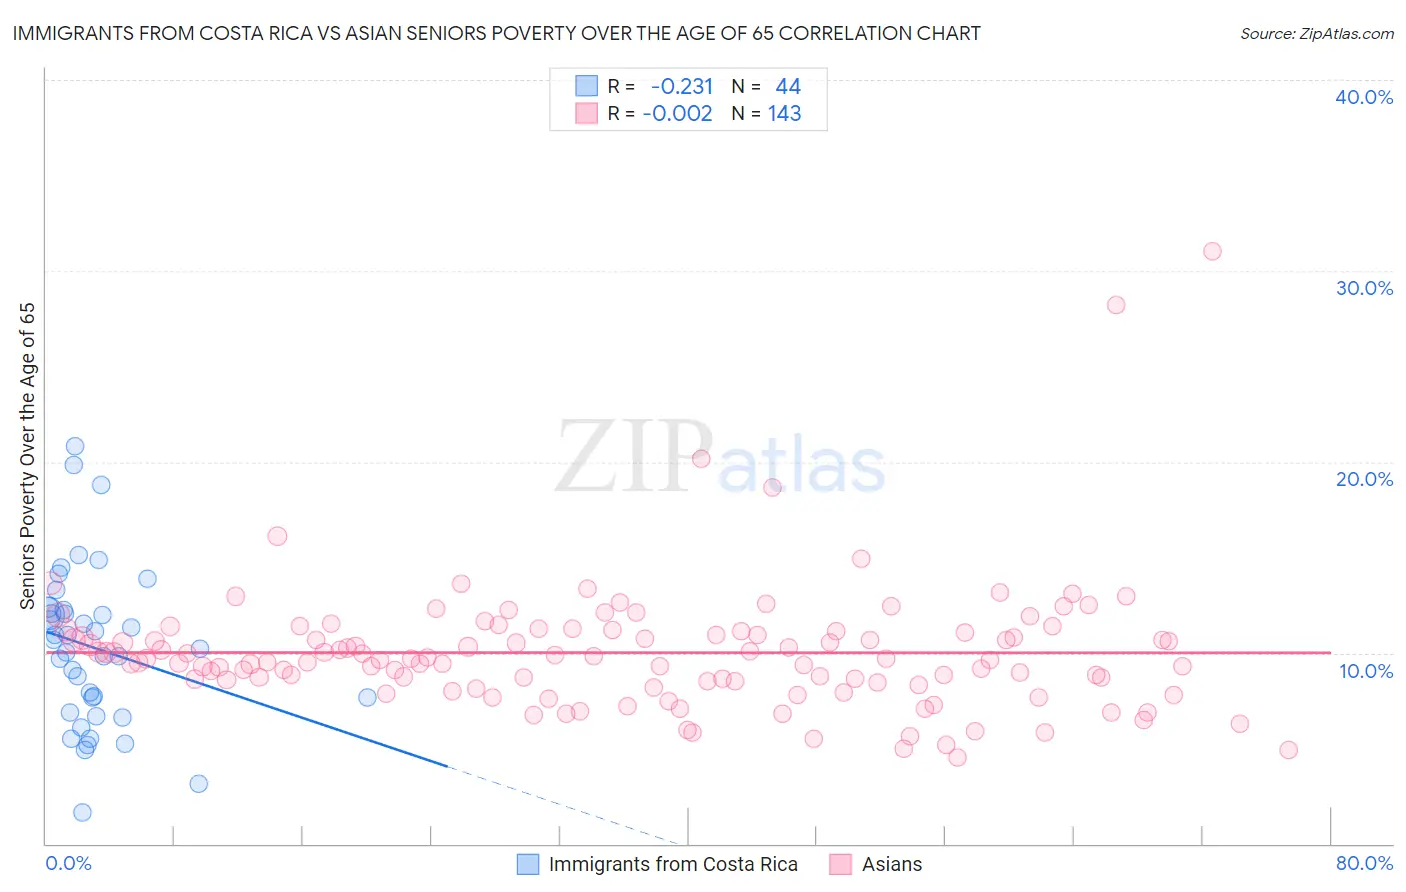
The statistical analysis conducted on geographies consisting of 204,045,079 people shows a weak negative correlation between the proportion of Immigrants from Costa Rica and poverty level among seniors over the age of 65 in the United States with a correlation coefficient (R) of -0.231 and weighted average of 11.8%. Similarly, the statistical analysis conducted on geographies consisting of 546,650,142 people shows no correlation between the proportion of Asians and poverty level among seniors over the age of 65 in the United States with a correlation coefficient (R) of -0.002 and weighted average of 10.4%, a difference of 13.5%.
Seniors Poverty Over the Age of 65 Correlation Summary
| Measurement | Immigrants from Costa Rica | Asian |
| Minimum | 1.7% | 4.5% |
| Maximum | 20.8% | 31.1% |
| Range | 19.1% | 26.5% |
| Mean | 10.3% | 10.0% |
| Median | 10.5% | 9.7% |
| Interquartile 25% (IQ1) | 7.3% | 8.5% |
| Interquartile 75% (IQ3) | 12.1% | 11.1% |
| Interquartile Range (IQR) | 4.9% | 2.6% |
| Standard Deviation (Sample) | 4.1% | 3.4% |
| Standard Deviation (Population) | 4.1% | 3.3% |
Similar Demographics by Seniors Poverty Over the Age of 65
Demographics Similar to Immigrants from Costa Rica by Seniors Poverty Over the Age of 65
In terms of seniors poverty over the age of 65, the demographic groups most similar to Immigrants from Costa Rica are Immigrants from Eritrea (11.8%, a difference of 0.080%), Nigerian (11.8%, a difference of 0.33%), Liberian (11.8%, a difference of 0.36%), Immigrants from Belarus (11.8%, a difference of 0.38%), and Immigrants from Nigeria (11.7%, a difference of 0.48%).
| Demographics | Rating | Rank | Seniors Poverty Over the Age of 65 |
| Argentineans | 4.1 /100 | #221 | Tragic 11.7% |
| Immigrants | Chile | 3.9 /100 | #222 | Tragic 11.7% |
| Immigrants | Congo | 3.8 /100 | #223 | Tragic 11.7% |
| Immigrants | Nigeria | 3.4 /100 | #224 | Tragic 11.7% |
| Immigrants | Belarus | 3.2 /100 | #225 | Tragic 11.8% |
| Liberians | 3.2 /100 | #226 | Tragic 11.8% |
| Nigerians | 3.2 /100 | #227 | Tragic 11.8% |
| Immigrants | Costa Rica | 2.7 /100 | #228 | Tragic 11.8% |
| Immigrants | Eritrea | 2.6 /100 | #229 | Tragic 11.8% |
| Bermudans | 2.1 /100 | #230 | Tragic 11.9% |
| Cajuns | 2.0 /100 | #231 | Tragic 11.9% |
| Yaqui | 1.9 /100 | #232 | Tragic 11.9% |
| Panamanians | 1.8 /100 | #233 | Tragic 11.9% |
| Iroquois | 1.7 /100 | #234 | Tragic 11.9% |
| Immigrants | Argentina | 1.3 /100 | #235 | Tragic 12.0% |
Demographics Similar to Asians by Seniors Poverty Over the Age of 65
In terms of seniors poverty over the age of 65, the demographic groups most similar to Asians are Hmong (10.4%, a difference of 0.030%), Immigrants from Philippines (10.4%, a difference of 0.14%), Immigrants from Hungary (10.4%, a difference of 0.20%), Immigrants from Iraq (10.4%, a difference of 0.21%), and Immigrants from Moldova (10.4%, a difference of 0.21%).
| Demographics | Rating | Rank | Seniors Poverty Over the Age of 65 |
| Lebanese | 92.0 /100 | #117 | Exceptional 10.3% |
| Okinawans | 91.7 /100 | #118 | Exceptional 10.4% |
| Immigrants | Western Europe | 91.1 /100 | #119 | Exceptional 10.4% |
| Immigrants | Bosnia and Herzegovina | 90.8 /100 | #120 | Exceptional 10.4% |
| Immigrants | Iraq | 90.7 /100 | #121 | Exceptional 10.4% |
| Immigrants | Moldova | 90.7 /100 | #122 | Exceptional 10.4% |
| Hmong | 90.0 /100 | #123 | Exceptional 10.4% |
| Asians | 89.9 /100 | #124 | Excellent 10.4% |
| Immigrants | Philippines | 89.4 /100 | #125 | Excellent 10.4% |
| Immigrants | Hungary | 89.1 /100 | #126 | Excellent 10.4% |
| Cambodians | 89.1 /100 | #127 | Excellent 10.4% |
| Ottawa | 88.5 /100 | #128 | Excellent 10.4% |
| Immigrants | Iran | 88.4 /100 | #129 | Excellent 10.4% |
| Immigrants | Oceania | 88.4 /100 | #130 | Excellent 10.4% |
| Egyptians | 87.8 /100 | #131 | Excellent 10.5% |