Immigrants from Iran vs Shoshone High School Diploma
COMPARE
Immigrants from Iran
Shoshone
High School Diploma
High School Diploma Comparison
Immigrants from Iran
Shoshone
90.9%
HIGH SCHOOL DIPLOMA
99.5/ 100
METRIC RATING
67th/ 347
METRIC RANK
88.3%
HIGH SCHOOL DIPLOMA
7.0/ 100
METRIC RATING
224th/ 347
METRIC RANK
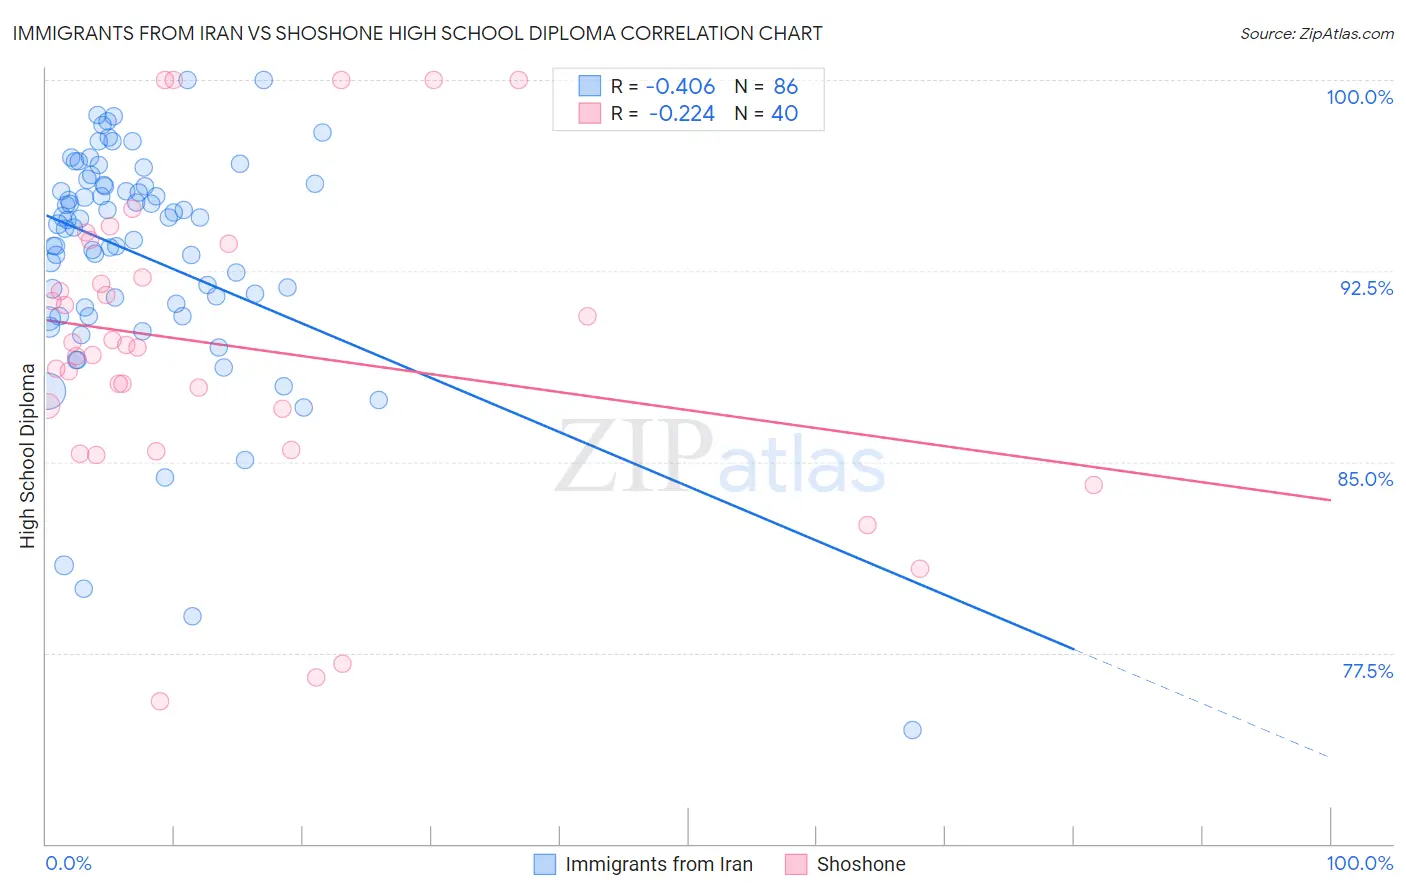
Immigrants from Iran vs Shoshone High School Diploma Correlation Chart
The statistical analysis conducted on geographies consisting of 279,904,902 people shows a moderate negative correlation between the proportion of Immigrants from Iran and percentage of population with at least high school diploma education in the United States with a correlation coefficient (R) of -0.406 and weighted average of 90.9%. Similarly, the statistical analysis conducted on geographies consisting of 66,627,351 people shows a weak negative correlation between the proportion of Shoshone and percentage of population with at least high school diploma education in the United States with a correlation coefficient (R) of -0.224 and weighted average of 88.3%, a difference of 3.0%.
High School Diploma Correlation Summary
| Measurement | Immigrants from Iran | Shoshone |
| Minimum | 74.5% | 75.6% |
| Maximum | 100.0% | 100.0% |
| Range | 25.5% | 24.4% |
| Mean | 93.1% | 89.5% |
| Median | 94.4% | 89.5% |
| Interquartile 25% (IQ1) | 91.1% | 86.3% |
| Interquartile 75% (IQ3) | 95.9% | 92.9% |
| Interquartile Range (IQR) | 4.8% | 6.6% |
| Standard Deviation (Sample) | 4.6% | 6.1% |
| Standard Deviation (Population) | 4.6% | 6.0% |
Similar Demographics by High School Diploma
Demographics Similar to Immigrants from Iran by High School Diploma
In terms of high school diploma, the demographic groups most similar to Immigrants from Iran are Czechoslovakian (90.9%, a difference of 0.010%), French (91.0%, a difference of 0.020%), Ukrainian (91.0%, a difference of 0.030%), Immigrants from South Africa (91.0%, a difference of 0.030%), and Immigrants from Netherlands (91.0%, a difference of 0.040%).
| Demographics | Rating | Rank | High School Diploma |
| Immigrants | Japan | 99.6 /100 | #60 | Exceptional 91.0% |
| Immigrants | Taiwan | 99.6 /100 | #61 | Exceptional 91.0% |
| Austrians | 99.6 /100 | #62 | Exceptional 91.0% |
| Immigrants | Netherlands | 99.6 /100 | #63 | Exceptional 91.0% |
| Ukrainians | 99.6 /100 | #64 | Exceptional 91.0% |
| Immigrants | South Africa | 99.6 /100 | #65 | Exceptional 91.0% |
| French | 99.5 /100 | #66 | Exceptional 91.0% |
| Immigrants | Iran | 99.5 /100 | #67 | Exceptional 90.9% |
| Czechoslovakians | 99.5 /100 | #68 | Exceptional 90.9% |
| French Canadians | 99.5 /100 | #69 | Exceptional 90.9% |
| Immigrants | Latvia | 99.5 /100 | #70 | Exceptional 90.9% |
| Alaskan Athabascans | 99.4 /100 | #71 | Exceptional 90.9% |
| Soviet Union | 99.4 /100 | #72 | Exceptional 90.9% |
| Immigrants | South Central Asia | 99.4 /100 | #73 | Exceptional 90.9% |
| Immigrants | Czechoslovakia | 99.4 /100 | #74 | Exceptional 90.9% |
Demographics Similar to Shoshone by High School Diploma
In terms of high school diploma, the demographic groups most similar to Shoshone are Creek (88.3%, a difference of 0.010%), Colville (88.3%, a difference of 0.040%), Immigrants from Zaire (88.3%, a difference of 0.040%), Immigrants from Afghanistan (88.3%, a difference of 0.090%), and Uruguayan (88.2%, a difference of 0.090%).
| Demographics | Rating | Rank | High School Diploma |
| Immigrants | Africa | 10.6 /100 | #217 | Poor 88.4% |
| Immigrants | Bolivia | 10.3 /100 | #218 | Poor 88.4% |
| Costa Ricans | 9.6 /100 | #219 | Tragic 88.4% |
| Tongans | 9.5 /100 | #220 | Tragic 88.4% |
| Immigrants | Afghanistan | 8.6 /100 | #221 | Tragic 88.3% |
| Colville | 7.8 /100 | #222 | Tragic 88.3% |
| Immigrants | Zaire | 7.6 /100 | #223 | Tragic 88.3% |
| Shoshone | 7.0 /100 | #224 | Tragic 88.3% |
| Creek | 6.9 /100 | #225 | Tragic 88.3% |
| Uruguayans | 5.6 /100 | #226 | Tragic 88.2% |
| Immigrants | Liberia | 5.5 /100 | #227 | Tragic 88.2% |
| Kiowa | 5.3 /100 | #228 | Tragic 88.2% |
| Nigerians | 5.2 /100 | #229 | Tragic 88.2% |
| Blackfeet | 4.2 /100 | #230 | Tragic 88.1% |
| Colombians | 3.8 /100 | #231 | Tragic 88.1% |