Immigrants from Iran vs Norwegian Child Poverty Under the Age of 16
COMPARE
Immigrants from Iran
Norwegian
Child Poverty Under the Age of 16
Child Poverty Under the Age of 16 Comparison
Immigrants from Iran
Norwegians
12.4%
CHILD POVERTY UNDER THE AGE OF 16
100.0/ 100
METRIC RATING
9th/ 347
METRIC RANK
13.0%
CHILD POVERTY UNDER THE AGE OF 16
99.9/ 100
METRIC RATING
16th/ 347
METRIC RANK
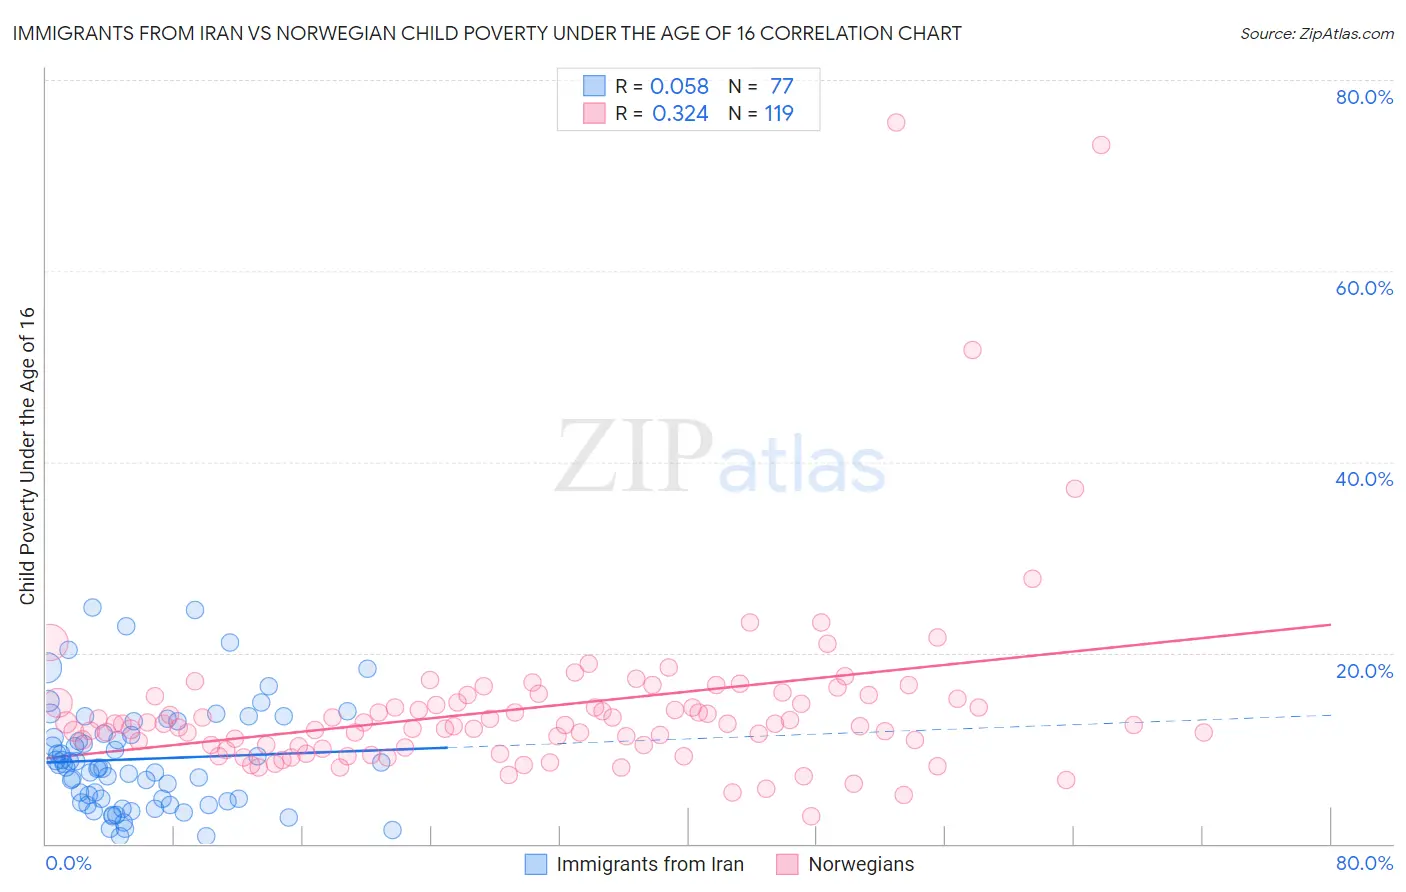
Immigrants from Iran vs Norwegian Child Poverty Under the Age of 16 Correlation Chart
The statistical analysis conducted on geographies consisting of 277,819,095 people shows a slight positive correlation between the proportion of Immigrants from Iran and poverty level among children under the age of 16 in the United States with a correlation coefficient (R) of 0.058 and weighted average of 12.4%. Similarly, the statistical analysis conducted on geographies consisting of 523,024,216 people shows a mild positive correlation between the proportion of Norwegians and poverty level among children under the age of 16 in the United States with a correlation coefficient (R) of 0.324 and weighted average of 13.0%, a difference of 4.7%.
Child Poverty Under the Age of 16 Correlation Summary
| Measurement | Immigrants from Iran | Norwegian |
| Minimum | 0.81% | 2.9% |
| Maximum | 24.8% | 75.6% |
| Range | 24.0% | 72.8% |
| Mean | 8.9% | 14.2% |
| Median | 8.0% | 12.5% |
| Interquartile 25% (IQ1) | 4.4% | 10.3% |
| Interquartile 75% (IQ3) | 12.2% | 15.1% |
| Interquartile Range (IQR) | 7.8% | 4.9% |
| Standard Deviation (Sample) | 5.6% | 9.8% |
| Standard Deviation (Population) | 5.5% | 9.7% |
Demographics Similar to Immigrants from Iran and Norwegians by Child Poverty Under the Age of 16
In terms of child poverty under the age of 16, the demographic groups most similar to Immigrants from Iran are Immigrants from Singapore (12.4%, a difference of 0.11%), Immigrants from South Central Asia (12.5%, a difference of 1.2%), Bhutanese (12.5%, a difference of 1.2%), Iranian (12.2%, a difference of 1.2%), and Immigrants from Hong Kong (12.1%, a difference of 2.0%). Similarly, the demographic groups most similar to Norwegians are Immigrants from Korea (13.0%, a difference of 0.050%), Bulgarian (13.0%, a difference of 0.22%), Immigrants from Lithuania (12.9%, a difference of 0.35%), Cypriot (13.0%, a difference of 0.64%), and Immigrants from Japan (13.0%, a difference of 0.68%).
| Demographics | Rating | Rank | Child Poverty Under the Age of 16 |
| Immigrants | Taiwan | 100.0 /100 | #2 | Exceptional 11.0% |
| Filipinos | 100.0 /100 | #3 | Exceptional 11.1% |
| Thais | 100.0 /100 | #4 | Exceptional 11.6% |
| Chinese | 100.0 /100 | #5 | Exceptional 11.9% |
| Immigrants | Hong Kong | 100.0 /100 | #6 | Exceptional 12.1% |
| Iranians | 100.0 /100 | #7 | Exceptional 12.2% |
| Immigrants | Singapore | 100.0 /100 | #8 | Exceptional 12.4% |
| Immigrants | Iran | 100.0 /100 | #9 | Exceptional 12.4% |
| Immigrants | South Central Asia | 99.9 /100 | #10 | Exceptional 12.5% |
| Bhutanese | 99.9 /100 | #11 | Exceptional 12.5% |
| Immigrants | Ireland | 99.9 /100 | #12 | Exceptional 12.7% |
| Burmese | 99.9 /100 | #13 | Exceptional 12.8% |
| Immigrants | Lithuania | 99.9 /100 | #14 | Exceptional 12.9% |
| Immigrants | Korea | 99.9 /100 | #15 | Exceptional 13.0% |
| Norwegians | 99.9 /100 | #16 | Exceptional 13.0% |
| Bulgarians | 99.9 /100 | #17 | Exceptional 13.0% |
| Cypriots | 99.9 /100 | #18 | Exceptional 13.0% |
| Immigrants | Japan | 99.8 /100 | #19 | Exceptional 13.0% |
| Okinawans | 99.8 /100 | #20 | Exceptional 13.1% |
| Immigrants | Eastern Asia | 99.8 /100 | #21 | Exceptional 13.1% |
| Maltese | 99.8 /100 | #22 | Exceptional 13.1% |