Immigrants from Iran vs Samoan Child Poverty Under the Age of 16
COMPARE
Immigrants from Iran
Samoan
Child Poverty Under the Age of 16
Child Poverty Under the Age of 16 Comparison
Immigrants from Iran
Samoans
12.4%
CHILD POVERTY UNDER THE AGE OF 16
100.0/ 100
METRIC RATING
9th/ 347
METRIC RANK
15.6%
CHILD POVERTY UNDER THE AGE OF 16
77.3/ 100
METRIC RATING
154th/ 347
METRIC RANK
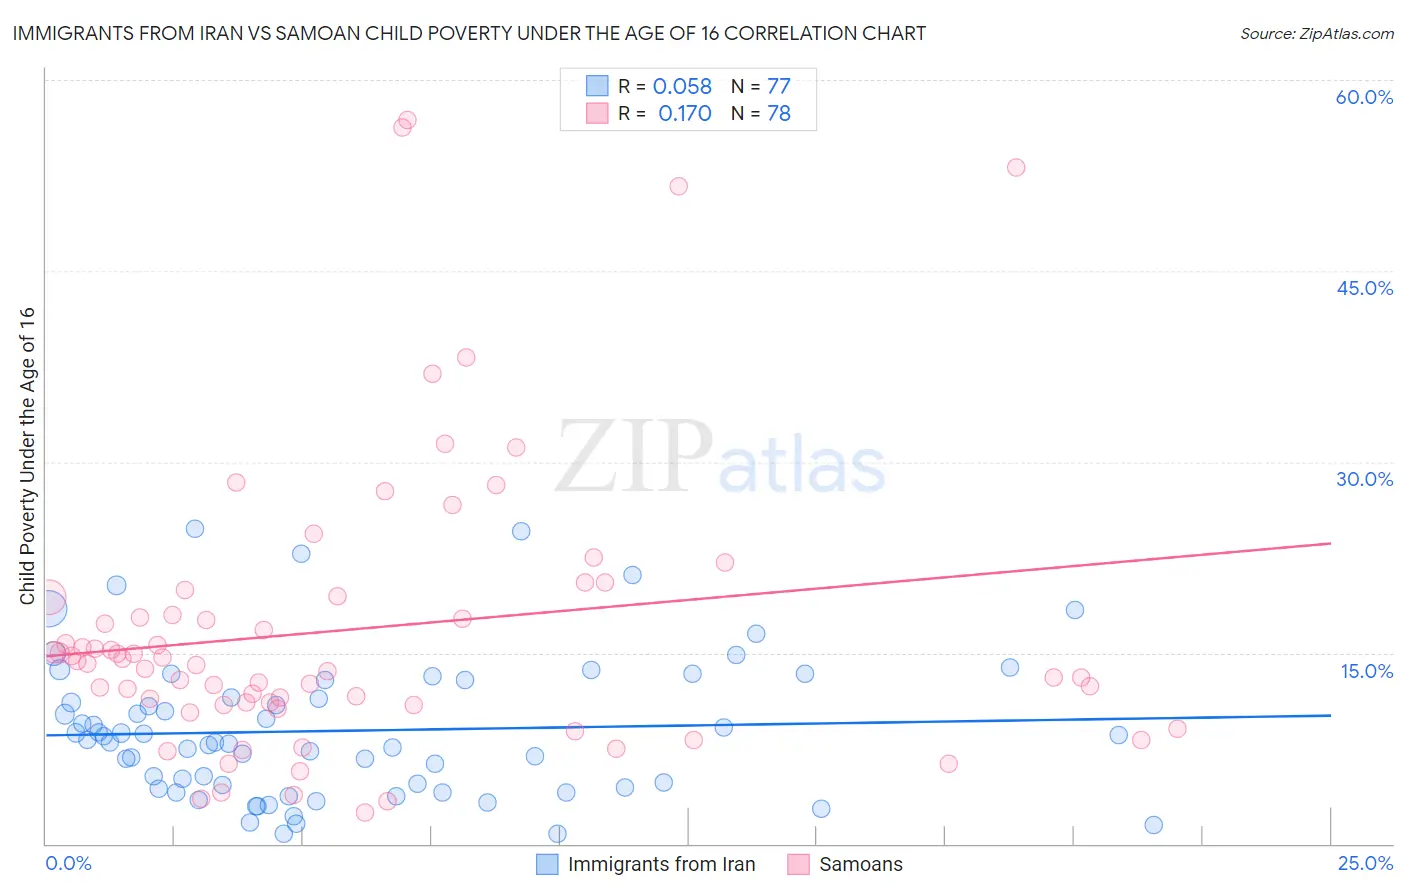
Immigrants from Iran vs Samoan Child Poverty Under the Age of 16 Correlation Chart
The statistical analysis conducted on geographies consisting of 277,819,095 people shows a slight positive correlation between the proportion of Immigrants from Iran and poverty level among children under the age of 16 in the United States with a correlation coefficient (R) of 0.058 and weighted average of 12.4%. Similarly, the statistical analysis conducted on geographies consisting of 224,526,833 people shows a poor positive correlation between the proportion of Samoans and poverty level among children under the age of 16 in the United States with a correlation coefficient (R) of 0.170 and weighted average of 15.6%, a difference of 26.1%.
Child Poverty Under the Age of 16 Correlation Summary
| Measurement | Immigrants from Iran | Samoan |
| Minimum | 0.81% | 2.5% |
| Maximum | 24.8% | 56.8% |
| Range | 24.0% | 54.4% |
| Mean | 8.9% | 16.9% |
| Median | 8.0% | 14.3% |
| Interquartile 25% (IQ1) | 4.4% | 10.9% |
| Interquartile 75% (IQ3) | 12.2% | 19.4% |
| Interquartile Range (IQR) | 7.8% | 8.5% |
| Standard Deviation (Sample) | 5.6% | 11.4% |
| Standard Deviation (Population) | 5.5% | 11.4% |
Similar Demographics by Child Poverty Under the Age of 16
Demographics Similar to Immigrants from Iran by Child Poverty Under the Age of 16
In terms of child poverty under the age of 16, the demographic groups most similar to Immigrants from Iran are Immigrants from Singapore (12.4%, a difference of 0.11%), Immigrants from South Central Asia (12.5%, a difference of 1.2%), Bhutanese (12.5%, a difference of 1.2%), Iranian (12.2%, a difference of 1.2%), and Immigrants from Hong Kong (12.1%, a difference of 2.0%).
| Demographics | Rating | Rank | Child Poverty Under the Age of 16 |
| Immigrants | Taiwan | 100.0 /100 | #2 | Exceptional 11.0% |
| Filipinos | 100.0 /100 | #3 | Exceptional 11.1% |
| Thais | 100.0 /100 | #4 | Exceptional 11.6% |
| Chinese | 100.0 /100 | #5 | Exceptional 11.9% |
| Immigrants | Hong Kong | 100.0 /100 | #6 | Exceptional 12.1% |
| Iranians | 100.0 /100 | #7 | Exceptional 12.2% |
| Immigrants | Singapore | 100.0 /100 | #8 | Exceptional 12.4% |
| Immigrants | Iran | 100.0 /100 | #9 | Exceptional 12.4% |
| Immigrants | South Central Asia | 99.9 /100 | #10 | Exceptional 12.5% |
| Bhutanese | 99.9 /100 | #11 | Exceptional 12.5% |
| Immigrants | Ireland | 99.9 /100 | #12 | Exceptional 12.7% |
| Burmese | 99.9 /100 | #13 | Exceptional 12.8% |
| Immigrants | Lithuania | 99.9 /100 | #14 | Exceptional 12.9% |
| Immigrants | Korea | 99.9 /100 | #15 | Exceptional 13.0% |
| Norwegians | 99.9 /100 | #16 | Exceptional 13.0% |
Demographics Similar to Samoans by Child Poverty Under the Age of 16
In terms of child poverty under the age of 16, the demographic groups most similar to Samoans are Venezuelan (15.6%, a difference of 0.030%), French Canadian (15.6%, a difference of 0.18%), Syrian (15.6%, a difference of 0.21%), Immigrants from Jordan (15.6%, a difference of 0.22%), and French (15.6%, a difference of 0.22%).
| Demographics | Rating | Rank | Child Poverty Under the Age of 16 |
| Immigrants | Kuwait | 80.5 /100 | #147 | Excellent 15.5% |
| Puget Sound Salish | 80.3 /100 | #148 | Excellent 15.5% |
| Israelis | 80.1 /100 | #149 | Excellent 15.5% |
| Immigrants | Jordan | 78.5 /100 | #150 | Good 15.6% |
| French | 78.5 /100 | #151 | Good 15.6% |
| French Canadians | 78.2 /100 | #152 | Good 15.6% |
| Venezuelans | 77.4 /100 | #153 | Good 15.6% |
| Samoans | 77.3 /100 | #154 | Good 15.6% |
| Syrians | 76.1 /100 | #155 | Good 15.6% |
| Immigrants | Venezuela | 74.9 /100 | #156 | Good 15.7% |
| Immigrants | Nepal | 72.9 /100 | #157 | Good 15.7% |
| Immigrants | Chile | 72.8 /100 | #158 | Good 15.7% |
| Immigrants | Fiji | 71.1 /100 | #159 | Good 15.8% |
| Immigrants | Albania | 70.7 /100 | #160 | Good 15.8% |
| Immigrants | Northern Africa | 68.1 /100 | #161 | Good 15.8% |