Immigrants from Indonesia vs Immigrants from Haiti Seniors Poverty Over the Age of 75
COMPARE
Immigrants from Indonesia
Immigrants from Haiti
Seniors Poverty Over the Age of 75
Seniors Poverty Over the Age of 75 Comparison
Immigrants from Indonesia
Immigrants from Haiti
12.5%
SENIORS POVERTY OVER THE AGE OF 75
24.4/ 100
METRIC RATING
189th/ 347
METRIC RANK
16.5%
SENIORS POVERTY OVER THE AGE OF 75
0.0/ 100
METRIC RATING
321st/ 347
METRIC RANK
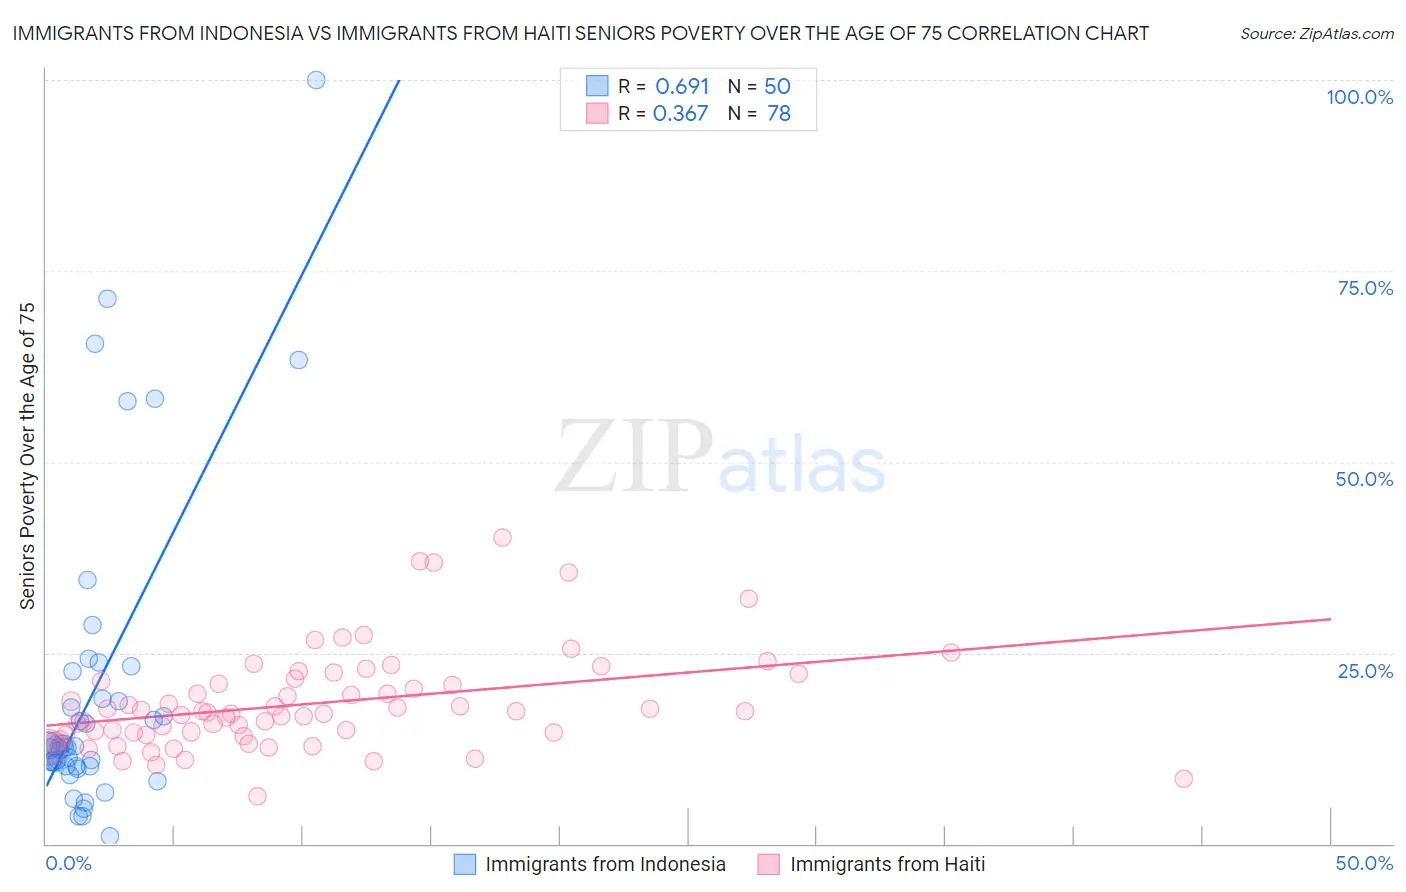
Immigrants from Indonesia vs Immigrants from Haiti Seniors Poverty Over the Age of 75 Correlation Chart
The statistical analysis conducted on geographies consisting of 214,419,611 people shows a significant positive correlation between the proportion of Immigrants from Indonesia and poverty level among seniors over the age of 75 in the United States with a correlation coefficient (R) of 0.691 and weighted average of 12.5%. Similarly, the statistical analysis conducted on geographies consisting of 223,608,368 people shows a mild positive correlation between the proportion of Immigrants from Haiti and poverty level among seniors over the age of 75 in the United States with a correlation coefficient (R) of 0.367 and weighted average of 16.5%, a difference of 32.5%.
Seniors Poverty Over the Age of 75 Correlation Summary
| Measurement | Immigrants from Indonesia | Immigrants from Haiti |
| Minimum | 0.93% | 6.2% |
| Maximum | 100.0% | 40.1% |
| Range | 99.1% | 33.9% |
| Mean | 19.9% | 18.4% |
| Median | 12.7% | 17.2% |
| Interquartile 25% (IQ1) | 10.2% | 14.3% |
| Interquartile 75% (IQ3) | 18.9% | 21.2% |
| Interquartile Range (IQR) | 8.7% | 6.9% |
| Standard Deviation (Sample) | 20.1% | 6.5% |
| Standard Deviation (Population) | 19.9% | 6.4% |
Similar Demographics by Seniors Poverty Over the Age of 75
Demographics Similar to Immigrants from Indonesia by Seniors Poverty Over the Age of 75
In terms of seniors poverty over the age of 75, the demographic groups most similar to Immigrants from Indonesia are Immigrants from Congo (12.5%, a difference of 0.060%), Immigrants from Northern Africa (12.5%, a difference of 0.090%), Liberian (12.5%, a difference of 0.13%), Yaqui (12.5%, a difference of 0.15%), and Choctaw (12.5%, a difference of 0.48%).
| Demographics | Rating | Rank | Seniors Poverty Over the Age of 75 |
| German Russians | 41.4 /100 | #182 | Average 12.3% |
| Laotians | 38.2 /100 | #183 | Fair 12.3% |
| Kiowa | 36.0 /100 | #184 | Fair 12.3% |
| Immigrants | Malaysia | 35.8 /100 | #185 | Fair 12.3% |
| Sri Lankans | 32.3 /100 | #186 | Fair 12.4% |
| Yaqui | 25.9 /100 | #187 | Fair 12.5% |
| Immigrants | Northern Africa | 25.2 /100 | #188 | Fair 12.5% |
| Immigrants | Indonesia | 24.4 /100 | #189 | Fair 12.5% |
| Immigrants | Congo | 23.9 /100 | #190 | Fair 12.5% |
| Liberians | 23.2 /100 | #191 | Fair 12.5% |
| Choctaw | 20.2 /100 | #192 | Fair 12.5% |
| Taiwanese | 17.8 /100 | #193 | Poor 12.6% |
| Alsatians | 17.7 /100 | #194 | Poor 12.6% |
| Immigrants | France | 17.4 /100 | #195 | Poor 12.6% |
| Immigrants | Eastern Europe | 16.0 /100 | #196 | Poor 12.6% |
Demographics Similar to Immigrants from Haiti by Seniors Poverty Over the Age of 75
In terms of seniors poverty over the age of 75, the demographic groups most similar to Immigrants from Haiti are Immigrants from Barbados (16.5%, a difference of 0.020%), Central American Indian (16.5%, a difference of 0.11%), Immigrants from Uzbekistan (16.5%, a difference of 0.16%), Immigrants from Yemen (16.5%, a difference of 0.18%), and Nicaraguan (16.6%, a difference of 0.55%).
| Demographics | Rating | Rank | Seniors Poverty Over the Age of 75 |
| Tsimshian | 0.0 /100 | #314 | Tragic 16.1% |
| Guyanese | 0.0 /100 | #315 | Tragic 16.1% |
| Immigrants | Ecuador | 0.0 /100 | #316 | Tragic 16.1% |
| Immigrants | Guyana | 0.0 /100 | #317 | Tragic 16.2% |
| Houma | 0.0 /100 | #318 | Tragic 16.2% |
| Haitians | 0.0 /100 | #319 | Tragic 16.2% |
| Immigrants | Yemen | 0.0 /100 | #320 | Tragic 16.5% |
| Immigrants | Haiti | 0.0 /100 | #321 | Tragic 16.5% |
| Immigrants | Barbados | 0.0 /100 | #322 | Tragic 16.5% |
| Central American Indians | 0.0 /100 | #323 | Tragic 16.5% |
| Immigrants | Uzbekistan | 0.0 /100 | #324 | Tragic 16.5% |
| Nicaraguans | 0.0 /100 | #325 | Tragic 16.6% |
| Pueblo | 0.0 /100 | #326 | Tragic 16.7% |
| Sioux | 0.0 /100 | #327 | Tragic 16.8% |
| Cape Verdeans | 0.0 /100 | #328 | Tragic 16.8% |