Immigrants from Indonesia vs Filipino Seniors Poverty Over the Age of 75
COMPARE
Immigrants from Indonesia
Filipino
Seniors Poverty Over the Age of 75
Seniors Poverty Over the Age of 75 Comparison
Immigrants from Indonesia
Filipinos
12.5%
SENIORS POVERTY OVER THE AGE OF 75
24.4/ 100
METRIC RATING
189th/ 347
METRIC RANK
11.4%
SENIORS POVERTY OVER THE AGE OF 75
95.5/ 100
METRIC RATING
79th/ 347
METRIC RANK
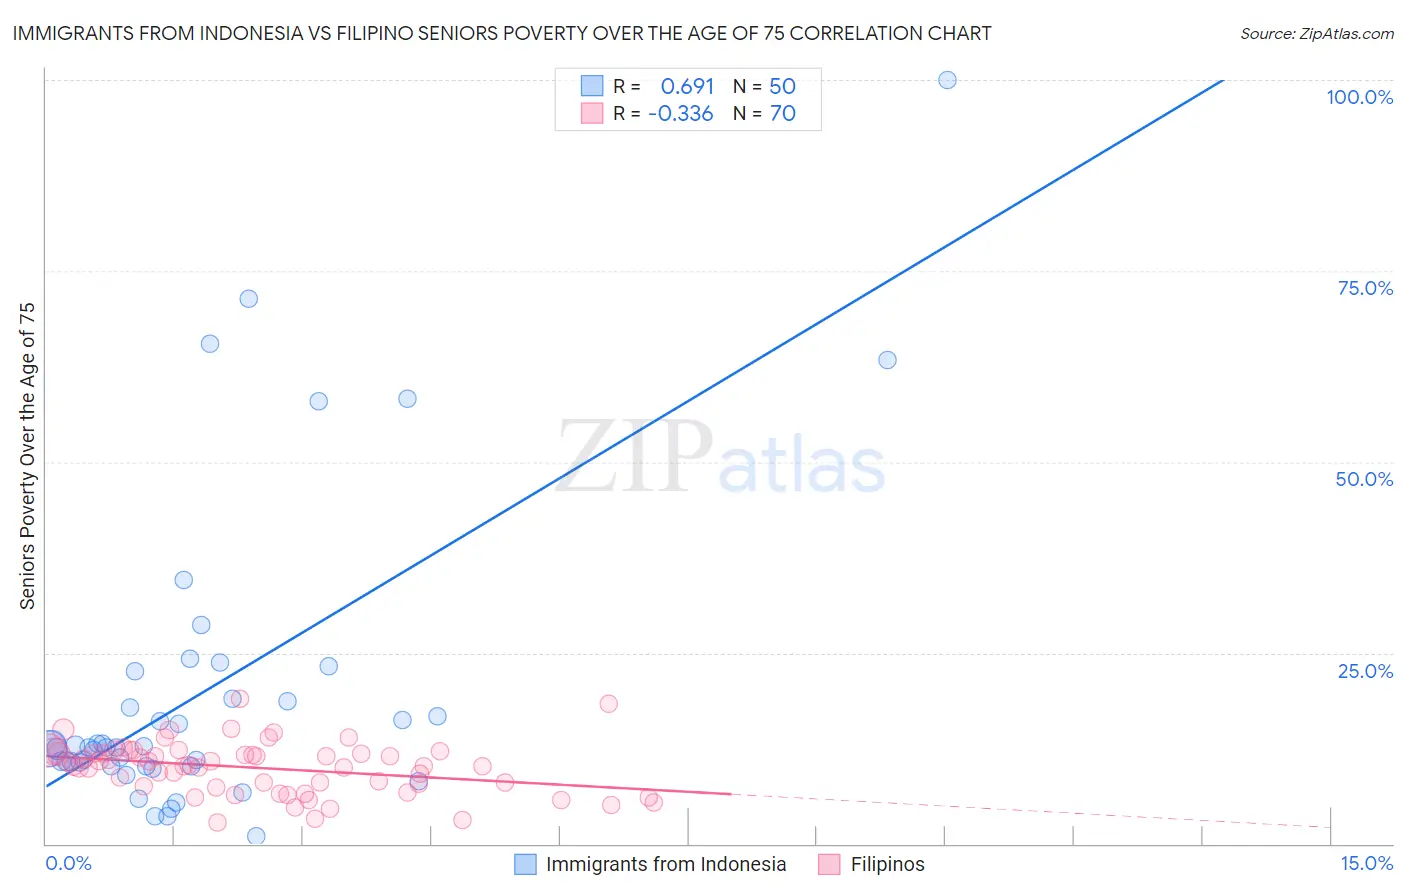
Immigrants from Indonesia vs Filipino Seniors Poverty Over the Age of 75 Correlation Chart
The statistical analysis conducted on geographies consisting of 214,419,611 people shows a significant positive correlation between the proportion of Immigrants from Indonesia and poverty level among seniors over the age of 75 in the United States with a correlation coefficient (R) of 0.691 and weighted average of 12.5%. Similarly, the statistical analysis conducted on geographies consisting of 252,177,792 people shows a mild negative correlation between the proportion of Filipinos and poverty level among seniors over the age of 75 in the United States with a correlation coefficient (R) of -0.336 and weighted average of 11.4%, a difference of 9.0%.
Seniors Poverty Over the Age of 75 Correlation Summary
| Measurement | Immigrants from Indonesia | Filipino |
| Minimum | 0.93% | 2.8% |
| Maximum | 100.0% | 18.9% |
| Range | 99.1% | 16.1% |
| Mean | 19.9% | 9.9% |
| Median | 12.7% | 10.3% |
| Interquartile 25% (IQ1) | 10.2% | 7.5% |
| Interquartile 75% (IQ3) | 18.9% | 11.8% |
| Interquartile Range (IQR) | 8.7% | 4.3% |
| Standard Deviation (Sample) | 20.1% | 3.3% |
| Standard Deviation (Population) | 19.9% | 3.3% |
Similar Demographics by Seniors Poverty Over the Age of 75
Demographics Similar to Immigrants from Indonesia by Seniors Poverty Over the Age of 75
In terms of seniors poverty over the age of 75, the demographic groups most similar to Immigrants from Indonesia are Immigrants from Congo (12.5%, a difference of 0.060%), Immigrants from Northern Africa (12.5%, a difference of 0.090%), Liberian (12.5%, a difference of 0.13%), Yaqui (12.5%, a difference of 0.15%), and Choctaw (12.5%, a difference of 0.48%).
| Demographics | Rating | Rank | Seniors Poverty Over the Age of 75 |
| German Russians | 41.4 /100 | #182 | Average 12.3% |
| Laotians | 38.2 /100 | #183 | Fair 12.3% |
| Kiowa | 36.0 /100 | #184 | Fair 12.3% |
| Immigrants | Malaysia | 35.8 /100 | #185 | Fair 12.3% |
| Sri Lankans | 32.3 /100 | #186 | Fair 12.4% |
| Yaqui | 25.9 /100 | #187 | Fair 12.5% |
| Immigrants | Northern Africa | 25.2 /100 | #188 | Fair 12.5% |
| Immigrants | Indonesia | 24.4 /100 | #189 | Fair 12.5% |
| Immigrants | Congo | 23.9 /100 | #190 | Fair 12.5% |
| Liberians | 23.2 /100 | #191 | Fair 12.5% |
| Choctaw | 20.2 /100 | #192 | Fair 12.5% |
| Taiwanese | 17.8 /100 | #193 | Poor 12.6% |
| Alsatians | 17.7 /100 | #194 | Poor 12.6% |
| Immigrants | France | 17.4 /100 | #195 | Poor 12.6% |
| Immigrants | Eastern Europe | 16.0 /100 | #196 | Poor 12.6% |
Demographics Similar to Filipinos by Seniors Poverty Over the Age of 75
In terms of seniors poverty over the age of 75, the demographic groups most similar to Filipinos are Macedonian (11.4%, a difference of 0.0%), White/Caucasian (11.4%, a difference of 0.020%), Alaska Native (11.4%, a difference of 0.060%), French Canadian (11.4%, a difference of 0.10%), and Palestinian (11.4%, a difference of 0.16%).
| Demographics | Rating | Rank | Seniors Poverty Over the Age of 75 |
| Sierra Leoneans | 96.1 /100 | #72 | Exceptional 11.4% |
| Immigrants | Micronesia | 96.0 /100 | #73 | Exceptional 11.4% |
| Delaware | 96.0 /100 | #74 | Exceptional 11.4% |
| Palestinians | 95.8 /100 | #75 | Exceptional 11.4% |
| French Canadians | 95.7 /100 | #76 | Exceptional 11.4% |
| Whites/Caucasians | 95.5 /100 | #77 | Exceptional 11.4% |
| Macedonians | 95.5 /100 | #78 | Exceptional 11.4% |
| Filipinos | 95.5 /100 | #79 | Exceptional 11.4% |
| Alaska Natives | 95.4 /100 | #80 | Exceptional 11.4% |
| Basques | 95.1 /100 | #81 | Exceptional 11.5% |
| Iranians | 95.1 /100 | #82 | Exceptional 11.5% |
| Immigrants | South Africa | 94.9 /100 | #83 | Exceptional 11.5% |
| Immigrants | Iraq | 94.9 /100 | #84 | Exceptional 11.5% |
| Immigrants | Bulgaria | 94.7 /100 | #85 | Exceptional 11.5% |
| Australians | 94.6 /100 | #86 | Exceptional 11.5% |