Immigrants from Indonesia vs Immigrants from Egypt Seniors Poverty Over the Age of 75
COMPARE
Immigrants from Indonesia
Immigrants from Egypt
Seniors Poverty Over the Age of 75
Seniors Poverty Over the Age of 75 Comparison
Immigrants from Indonesia
Immigrants from Egypt
12.5%
SENIORS POVERTY OVER THE AGE OF 75
24.4/ 100
METRIC RATING
189th/ 347
METRIC RANK
12.2%
SENIORS POVERTY OVER THE AGE OF 75
53.7/ 100
METRIC RATING
169th/ 347
METRIC RANK
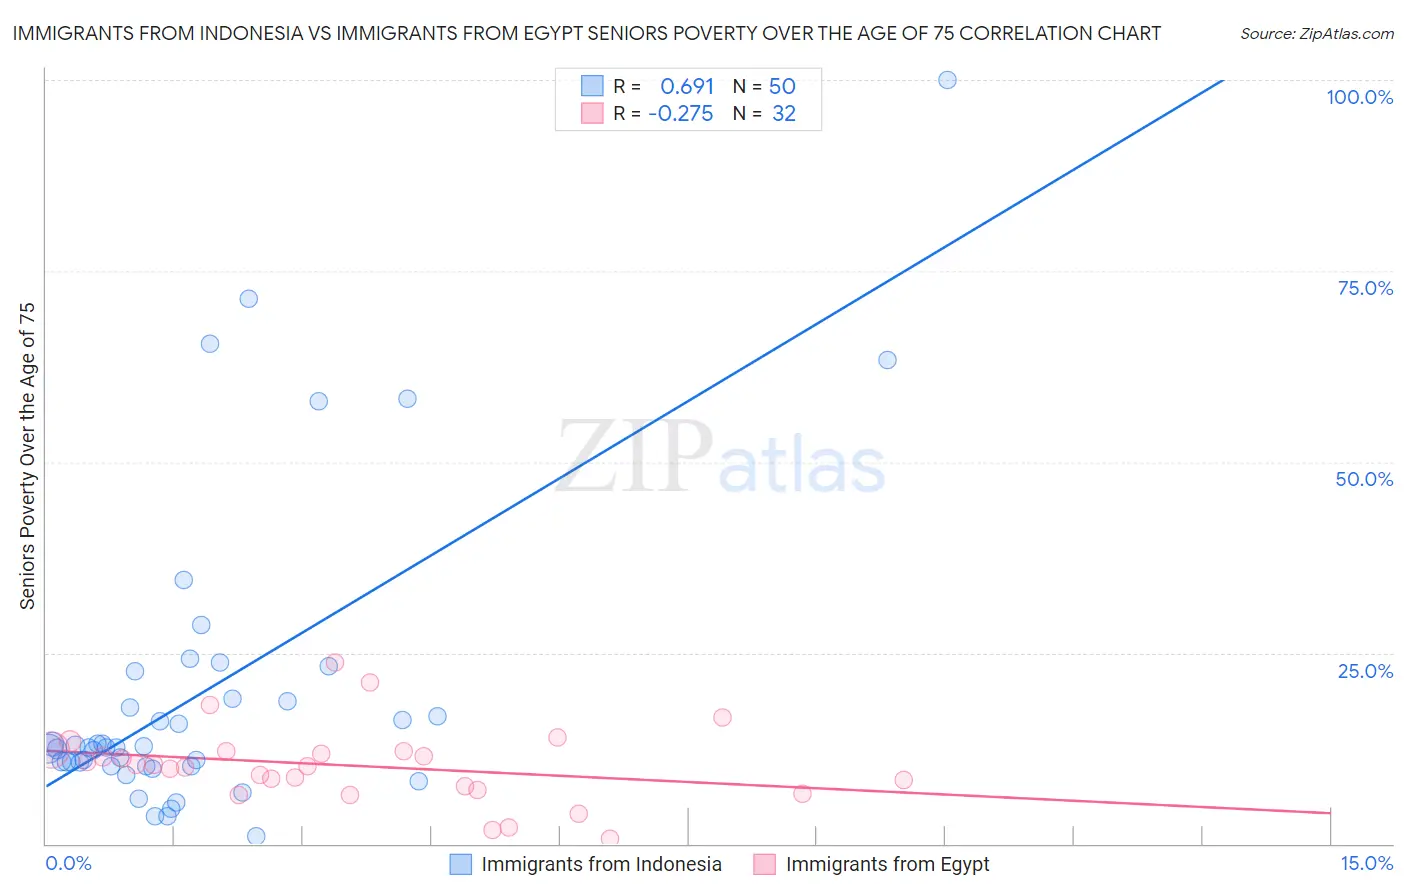
Immigrants from Indonesia vs Immigrants from Egypt Seniors Poverty Over the Age of 75 Correlation Chart
The statistical analysis conducted on geographies consisting of 214,419,611 people shows a significant positive correlation between the proportion of Immigrants from Indonesia and poverty level among seniors over the age of 75 in the United States with a correlation coefficient (R) of 0.691 and weighted average of 12.5%. Similarly, the statistical analysis conducted on geographies consisting of 243,675,721 people shows a weak negative correlation between the proportion of Immigrants from Egypt and poverty level among seniors over the age of 75 in the United States with a correlation coefficient (R) of -0.275 and weighted average of 12.2%, a difference of 2.6%.
Seniors Poverty Over the Age of 75 Correlation Summary
| Measurement | Immigrants from Indonesia | Immigrants from Egypt |
| Minimum | 0.93% | 0.66% |
| Maximum | 100.0% | 23.7% |
| Range | 99.1% | 23.1% |
| Mean | 19.9% | 10.2% |
| Median | 12.7% | 10.3% |
| Interquartile 25% (IQ1) | 10.2% | 7.3% |
| Interquartile 75% (IQ3) | 18.9% | 12.1% |
| Interquartile Range (IQR) | 8.7% | 4.8% |
| Standard Deviation (Sample) | 20.1% | 5.0% |
| Standard Deviation (Population) | 19.9% | 5.0% |
Demographics Similar to Immigrants from Indonesia and Immigrants from Egypt by Seniors Poverty Over the Age of 75
In terms of seniors poverty over the age of 75, the demographic groups most similar to Immigrants from Indonesia are Immigrants from Northern Africa (12.5%, a difference of 0.090%), Yaqui (12.5%, a difference of 0.15%), Sri Lankan (12.4%, a difference of 0.78%), Immigrants from Malaysia (12.3%, a difference of 1.1%), and Kiowa (12.3%, a difference of 1.1%). Similarly, the demographic groups most similar to Immigrants from Egypt are Immigrants from Thailand (12.2%, a difference of 0.14%), Spaniard (12.2%, a difference of 0.18%), Immigrants from Fiji (12.2%, a difference of 0.18%), Arab (12.2%, a difference of 0.27%), and Immigrants from Europe (12.2%, a difference of 0.31%).
| Demographics | Rating | Rank | Seniors Poverty Over the Age of 75 |
| Immigrants | Egypt | 53.7 /100 | #169 | Average 12.2% |
| Immigrants | Thailand | 52.0 /100 | #170 | Average 12.2% |
| Spaniards | 51.6 /100 | #171 | Average 12.2% |
| Immigrants | Fiji | 51.5 /100 | #172 | Average 12.2% |
| Arabs | 50.5 /100 | #173 | Average 12.2% |
| Immigrants | Europe | 50.0 /100 | #174 | Average 12.2% |
| Immigrants | Saudi Arabia | 49.5 /100 | #175 | Average 12.2% |
| Immigrants | Iran | 48.1 /100 | #176 | Average 12.2% |
| Immigrants | Asia | 47.8 /100 | #177 | Average 12.2% |
| Immigrants | Nonimmigrants | 46.8 /100 | #178 | Average 12.2% |
| Mongolians | 45.5 /100 | #179 | Average 12.2% |
| Immigrants | South Eastern Asia | 44.3 /100 | #180 | Average 12.2% |
| Immigrants | Australia | 44.2 /100 | #181 | Average 12.2% |
| German Russians | 41.4 /100 | #182 | Average 12.3% |
| Laotians | 38.2 /100 | #183 | Fair 12.3% |
| Kiowa | 36.0 /100 | #184 | Fair 12.3% |
| Immigrants | Malaysia | 35.8 /100 | #185 | Fair 12.3% |
| Sri Lankans | 32.3 /100 | #186 | Fair 12.4% |
| Yaqui | 25.9 /100 | #187 | Fair 12.5% |
| Immigrants | Northern Africa | 25.2 /100 | #188 | Fair 12.5% |
| Immigrants | Indonesia | 24.4 /100 | #189 | Fair 12.5% |