Immigrants from India vs Immigrants from Thailand Poverty
COMPARE
Immigrants from India
Immigrants from Thailand
Poverty
Poverty Comparison
Immigrants from India
Immigrants from Thailand
9.0%
POVERTY
100.0/ 100
METRIC RATING
1st/ 347
METRIC RANK
13.3%
POVERTY
3.1/ 100
METRIC RATING
218th/ 347
METRIC RANK
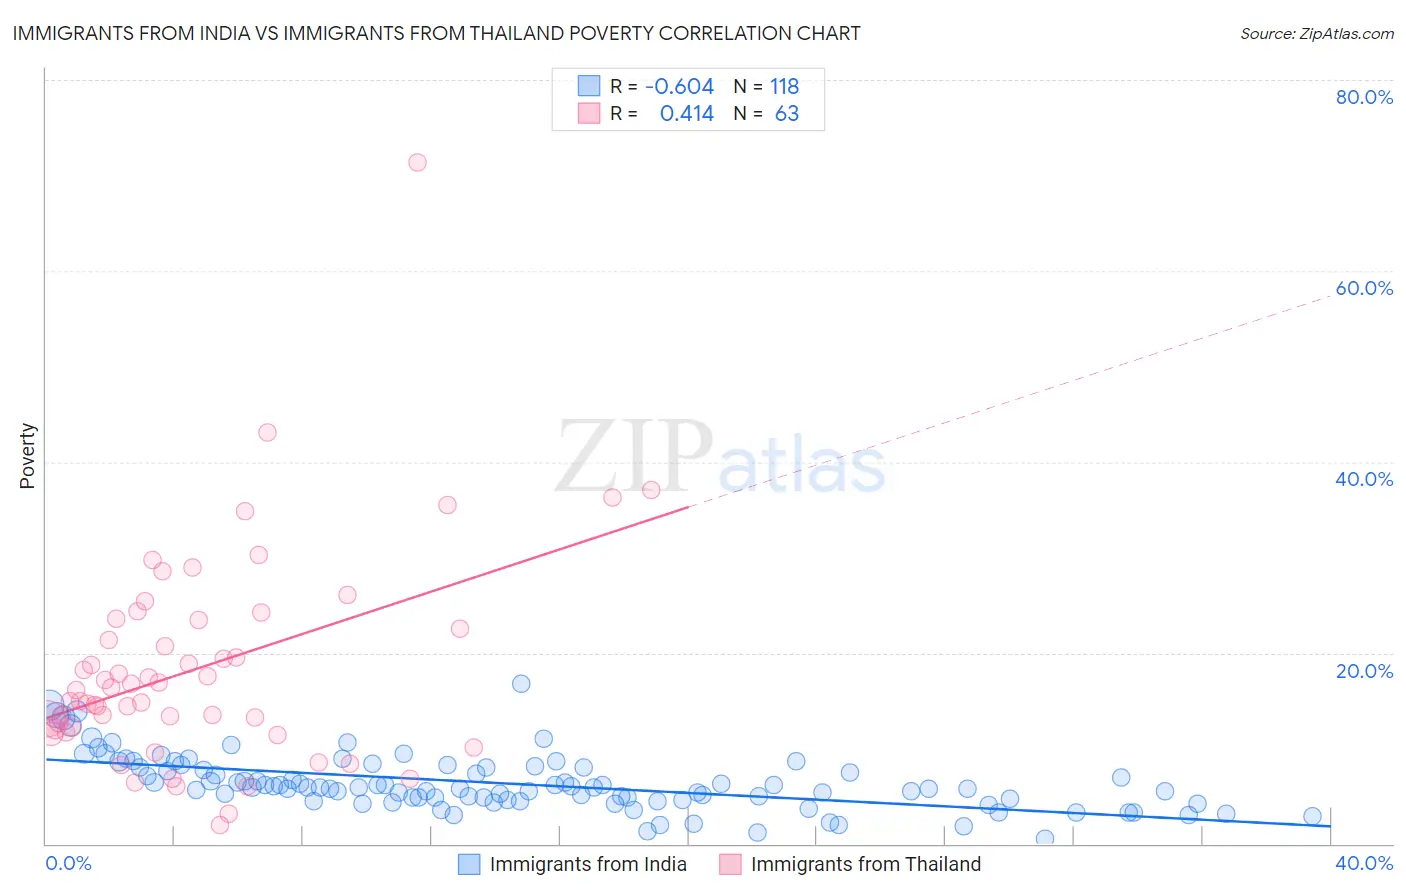
Immigrants from India vs Immigrants from Thailand Poverty Correlation Chart
The statistical analysis conducted on geographies consisting of 433,739,641 people shows a significant negative correlation between the proportion of Immigrants from India and poverty level in the United States with a correlation coefficient (R) of -0.604 and weighted average of 9.0%. Similarly, the statistical analysis conducted on geographies consisting of 316,935,515 people shows a moderate positive correlation between the proportion of Immigrants from Thailand and poverty level in the United States with a correlation coefficient (R) of 0.414 and weighted average of 13.3%, a difference of 47.6%.
Poverty Correlation Summary
| Measurement | Immigrants from India | Immigrants from Thailand |
| Minimum | 0.59% | 2.0% |
| Maximum | 16.8% | 71.4% |
| Range | 16.2% | 69.4% |
| Mean | 6.3% | 18.3% |
| Median | 5.9% | 16.1% |
| Interquartile 25% (IQ1) | 4.6% | 12.1% |
| Interquartile 75% (IQ3) | 8.0% | 23.4% |
| Interquartile Range (IQR) | 3.4% | 11.4% |
| Standard Deviation (Sample) | 2.8% | 11.1% |
| Standard Deviation (Population) | 2.8% | 11.0% |
Similar Demographics by Poverty
Demographics Similar to Immigrants from India by Poverty
In terms of poverty, the demographic groups most similar to Immigrants from India are Chinese (9.5%, a difference of 5.6%), Thai (9.6%, a difference of 6.1%), Immigrants from Taiwan (9.7%, a difference of 7.6%), Immigrants from Ireland (10.1%, a difference of 11.6%), and Assyrian/Chaldean/Syriac (10.1%, a difference of 11.8%).
| Demographics | Rating | Rank | Poverty |
| Immigrants | India | 100.0 /100 | #1 | Exceptional 9.0% |
| Chinese | 100.0 /100 | #2 | Exceptional 9.5% |
| Thais | 100.0 /100 | #3 | Exceptional 9.6% |
| Immigrants | Taiwan | 100.0 /100 | #4 | Exceptional 9.7% |
| Immigrants | Ireland | 99.9 /100 | #5 | Exceptional 10.1% |
| Assyrians/Chaldeans/Syriacs | 99.9 /100 | #6 | Exceptional 10.1% |
| Filipinos | 99.9 /100 | #7 | Exceptional 10.1% |
| Maltese | 99.9 /100 | #8 | Exceptional 10.2% |
| Immigrants | South Central Asia | 99.9 /100 | #9 | Exceptional 10.2% |
| Bulgarians | 99.9 /100 | #10 | Exceptional 10.2% |
| Immigrants | Lithuania | 99.9 /100 | #11 | Exceptional 10.3% |
| Bhutanese | 99.8 /100 | #12 | Exceptional 10.4% |
| Immigrants | Hong Kong | 99.8 /100 | #13 | Exceptional 10.4% |
| Immigrants | Bolivia | 99.8 /100 | #14 | Exceptional 10.4% |
| Bolivians | 99.8 /100 | #15 | Exceptional 10.4% |
Demographics Similar to Immigrants from Thailand by Poverty
In terms of poverty, the demographic groups most similar to Immigrants from Thailand are Immigrants from Uzbekistan (13.3%, a difference of 0.060%), Japanese (13.3%, a difference of 0.10%), Nonimmigrants (13.3%, a difference of 0.10%), Immigrants from Cambodia (13.4%, a difference of 0.12%), and American (13.4%, a difference of 0.21%).
| Demographics | Rating | Rank | Poverty |
| Moroccans | 5.2 /100 | #211 | Tragic 13.2% |
| Immigrants | Immigrants | 4.3 /100 | #212 | Tragic 13.2% |
| Immigrants | Panama | 4.1 /100 | #213 | Tragic 13.3% |
| Bermudans | 3.7 /100 | #214 | Tragic 13.3% |
| Japanese | 3.3 /100 | #215 | Tragic 13.3% |
| Immigrants | Nonimmigrants | 3.3 /100 | #216 | Tragic 13.3% |
| Immigrants | Uzbekistan | 3.2 /100 | #217 | Tragic 13.3% |
| Immigrants | Thailand | 3.1 /100 | #218 | Tragic 13.3% |
| Immigrants | Cambodia | 3.0 /100 | #219 | Tragic 13.4% |
| Americans | 2.9 /100 | #220 | Tragic 13.4% |
| Alsatians | 2.6 /100 | #221 | Tragic 13.4% |
| Immigrants | Micronesia | 2.6 /100 | #222 | Tragic 13.4% |
| Immigrants | Africa | 2.5 /100 | #223 | Tragic 13.4% |
| Immigrants | Eritrea | 2.4 /100 | #224 | Tragic 13.4% |
| German Russians | 2.2 /100 | #225 | Tragic 13.4% |