Immigrants from Honduras vs Assyrian/Chaldean/Syriac Male Poverty
COMPARE
Immigrants from Honduras
Assyrian/Chaldean/Syriac
Male Poverty
Male Poverty Comparison
Immigrants from Honduras
Assyrians/Chaldeans/Syriacs
14.6%
MALE POVERTY
0.0/ 100
METRIC RATING
314th/ 347
METRIC RANK
9.1%
MALE POVERTY
99.9/ 100
METRIC RATING
6th/ 347
METRIC RANK
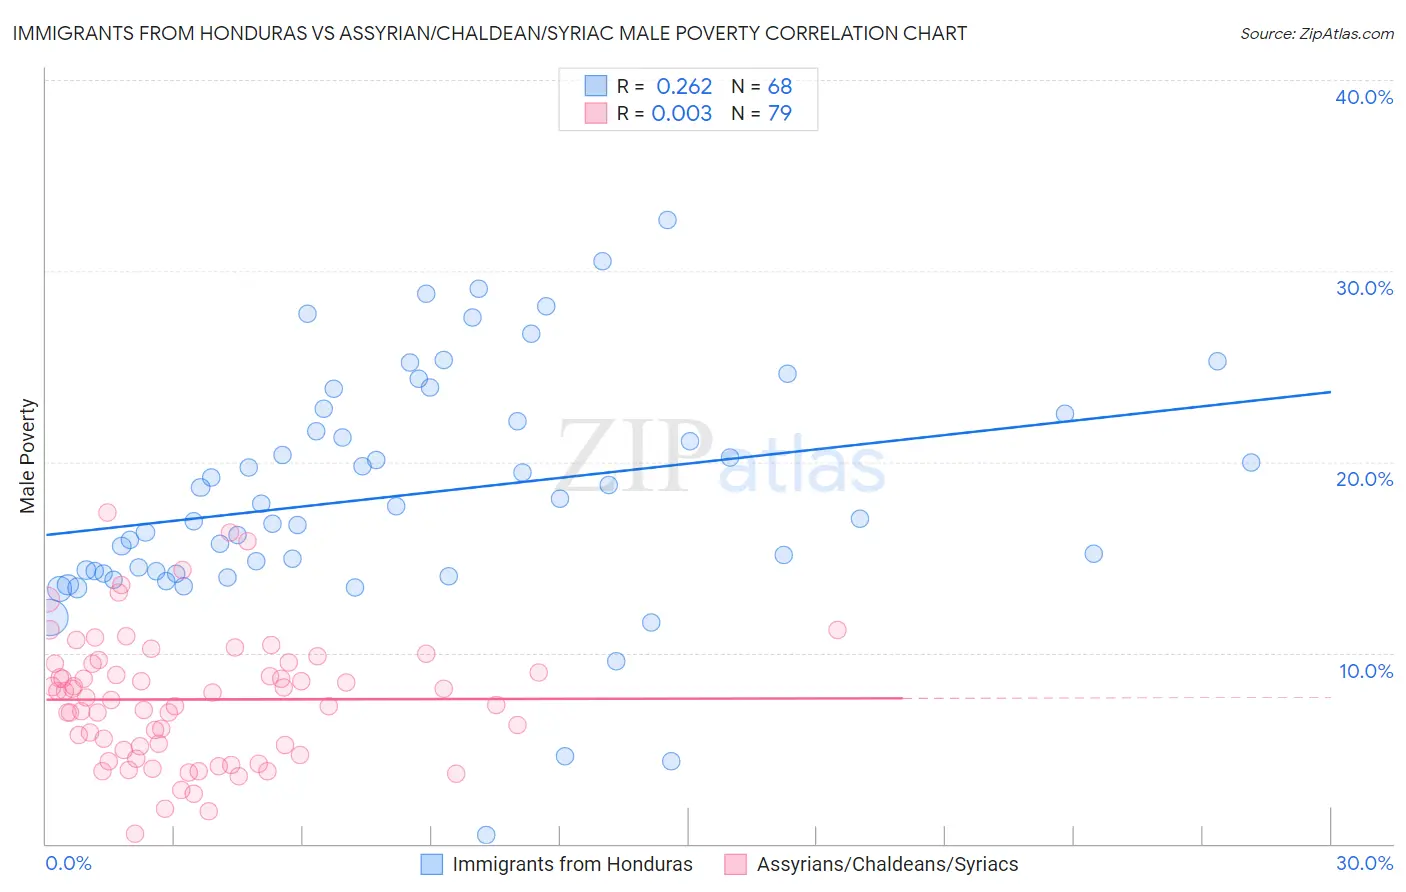
Immigrants from Honduras vs Assyrian/Chaldean/Syriac Male Poverty Correlation Chart
The statistical analysis conducted on geographies consisting of 322,443,990 people shows a weak positive correlation between the proportion of Immigrants from Honduras and poverty level among males in the United States with a correlation coefficient (R) of 0.262 and weighted average of 14.6%. Similarly, the statistical analysis conducted on geographies consisting of 110,288,408 people shows no correlation between the proportion of Assyrians/Chaldeans/Syriacs and poverty level among males in the United States with a correlation coefficient (R) of 0.003 and weighted average of 9.1%, a difference of 59.7%.
Male Poverty Correlation Summary
| Measurement | Immigrants from Honduras | Assyrian/Chaldean/Syriac |
| Minimum | 0.43% | 0.52% |
| Maximum | 32.7% | 17.3% |
| Range | 32.3% | 16.8% |
| Mean | 18.3% | 7.6% |
| Median | 17.4% | 7.6% |
| Interquartile 25% (IQ1) | 14.2% | 4.9% |
| Interquartile 75% (IQ3) | 22.3% | 9.4% |
| Interquartile Range (IQR) | 8.1% | 4.5% |
| Standard Deviation (Sample) | 6.2% | 3.4% |
| Standard Deviation (Population) | 6.1% | 3.4% |
Similar Demographics by Male Poverty
Demographics Similar to Immigrants from Honduras by Male Poverty
In terms of male poverty, the demographic groups most similar to Immigrants from Honduras are Immigrants from Somalia (14.6%, a difference of 0.040%), Chippewa (14.6%, a difference of 0.080%), British West Indian (14.6%, a difference of 0.10%), Immigrants from Dominica (14.7%, a difference of 0.78%), and Immigrants from Grenada (14.7%, a difference of 0.84%).
| Demographics | Rating | Rank | Male Poverty |
| Dutch West Indians | 0.0 /100 | #307 | Tragic 14.2% |
| Africans | 0.0 /100 | #308 | Tragic 14.2% |
| Somalis | 0.0 /100 | #309 | Tragic 14.3% |
| Seminole | 0.0 /100 | #310 | Tragic 14.3% |
| Hondurans | 0.0 /100 | #311 | Tragic 14.3% |
| Choctaw | 0.0 /100 | #312 | Tragic 14.4% |
| Immigrants | Somalia | 0.0 /100 | #313 | Tragic 14.6% |
| Immigrants | Honduras | 0.0 /100 | #314 | Tragic 14.6% |
| Chippewa | 0.0 /100 | #315 | Tragic 14.6% |
| British West Indians | 0.0 /100 | #316 | Tragic 14.6% |
| Immigrants | Dominica | 0.0 /100 | #317 | Tragic 14.7% |
| Immigrants | Grenada | 0.0 /100 | #318 | Tragic 14.7% |
| U.S. Virgin Islanders | 0.0 /100 | #319 | Tragic 14.7% |
| Immigrants | Congo | 0.0 /100 | #320 | Tragic 14.7% |
| Arapaho | 0.0 /100 | #321 | Tragic 15.1% |
Demographics Similar to Assyrians/Chaldeans/Syriacs by Male Poverty
In terms of male poverty, the demographic groups most similar to Assyrians/Chaldeans/Syriacs are Immigrants from Ireland (9.1%, a difference of 0.080%), Maltese (9.1%, a difference of 0.66%), Filipino (9.2%, a difference of 0.75%), Immigrants from South Central Asia (9.3%, a difference of 1.5%), and Bulgarian (9.3%, a difference of 2.1%).
| Demographics | Rating | Rank | Male Poverty |
| Immigrants | India | 100.0 /100 | #1 | Exceptional 8.2% |
| Chinese | 100.0 /100 | #2 | Exceptional 8.7% |
| Thais | 100.0 /100 | #3 | Exceptional 8.7% |
| Immigrants | Taiwan | 100.0 /100 | #4 | Exceptional 8.9% |
| Maltese | 100.0 /100 | #5 | Exceptional 9.1% |
| Assyrians/Chaldeans/Syriacs | 99.9 /100 | #6 | Exceptional 9.1% |
| Immigrants | Ireland | 99.9 /100 | #7 | Exceptional 9.1% |
| Filipinos | 99.9 /100 | #8 | Exceptional 9.2% |
| Immigrants | South Central Asia | 99.9 /100 | #9 | Exceptional 9.3% |
| Bulgarians | 99.9 /100 | #10 | Exceptional 9.3% |
| Bolivians | 99.9 /100 | #11 | Exceptional 9.4% |
| Immigrants | Bolivia | 99.9 /100 | #12 | Exceptional 9.4% |
| Immigrants | Lithuania | 99.9 /100 | #13 | Exceptional 9.4% |
| Immigrants | North Macedonia | 99.8 /100 | #14 | Exceptional 9.4% |
| Bhutanese | 99.8 /100 | #15 | Exceptional 9.5% |