Immigrants from Haiti vs Hispanic or Latino 4th Grade
COMPARE
Immigrants from Haiti
Hispanic or Latino
4th Grade
4th Grade Comparison
Immigrants from Haiti
Hispanics or Latinos
96.3%
4TH GRADE
0.0/ 100
METRIC RATING
307th/ 347
METRIC RANK
96.0%
4TH GRADE
0.0/ 100
METRIC RATING
326th/ 347
METRIC RANK
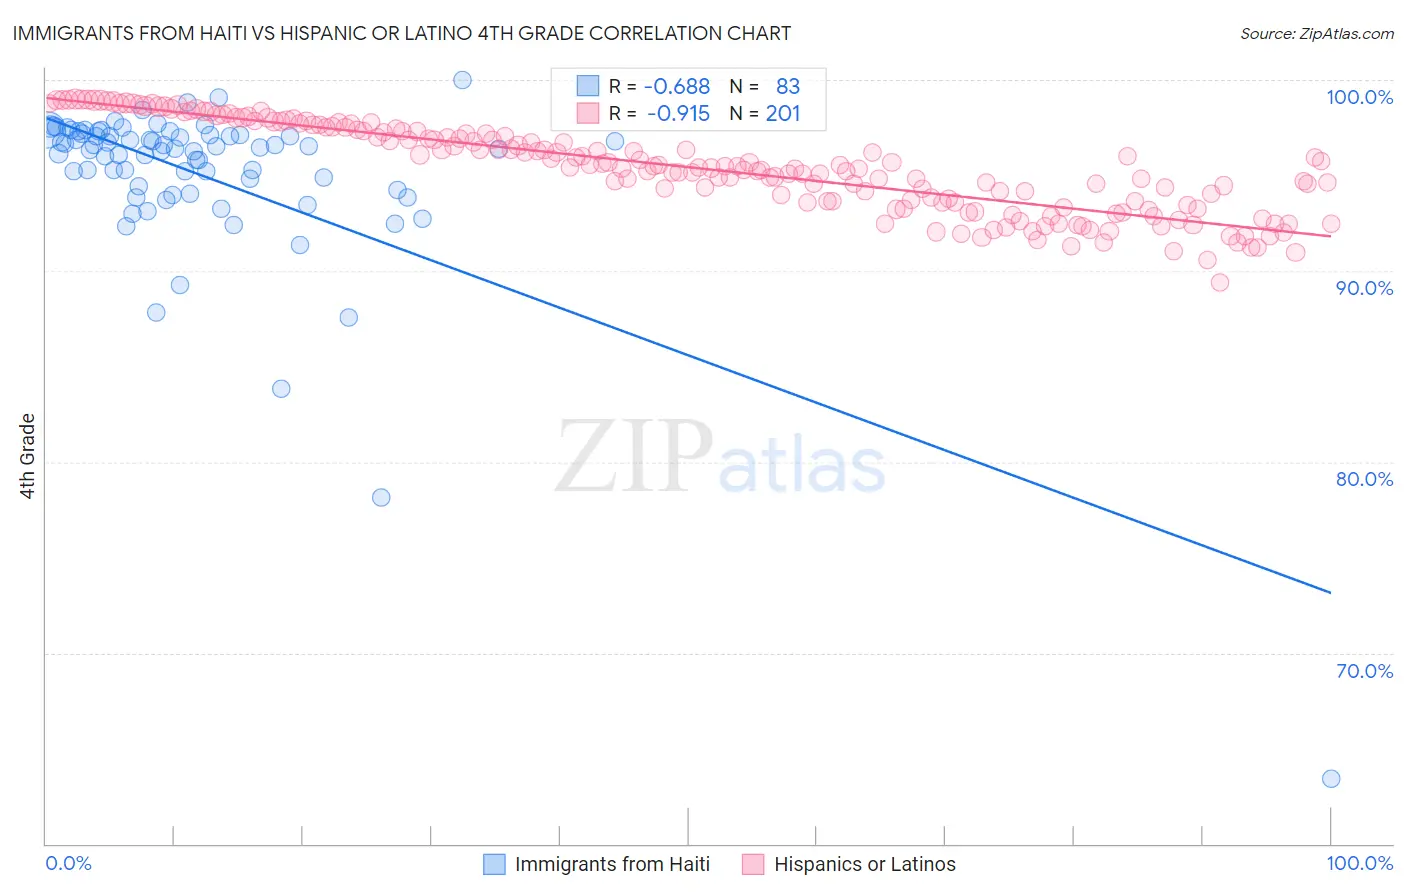
Immigrants from Haiti vs Hispanic or Latino 4th Grade Correlation Chart
The statistical analysis conducted on geographies consisting of 225,286,718 people shows a significant negative correlation between the proportion of Immigrants from Haiti and percentage of population with at least 4th grade education in the United States with a correlation coefficient (R) of -0.688 and weighted average of 96.3%. Similarly, the statistical analysis conducted on geographies consisting of 578,615,318 people shows a near-perfect negative correlation between the proportion of Hispanics or Latinos and percentage of population with at least 4th grade education in the United States with a correlation coefficient (R) of -0.915 and weighted average of 96.0%, a difference of 0.37%.
4th Grade Correlation Summary
| Measurement | Immigrants from Haiti | Hispanic or Latino |
| Minimum | 63.4% | 89.4% |
| Maximum | 100.0% | 99.0% |
| Range | 36.6% | 9.6% |
| Mean | 95.0% | 95.4% |
| Median | 96.4% | 95.5% |
| Interquartile 25% (IQ1) | 94.2% | 93.6% |
| Interquartile 75% (IQ3) | 97.1% | 97.4% |
| Interquartile Range (IQR) | 2.9% | 3.8% |
| Standard Deviation (Sample) | 4.8% | 2.3% |
| Standard Deviation (Population) | 4.7% | 2.3% |
Demographics Similar to Immigrants from Haiti and Hispanics or Latinos by 4th Grade
In terms of 4th grade, the demographic groups most similar to Immigrants from Haiti are Immigrants from Laos (96.3%, a difference of 0.010%), Immigrants from Guyana (96.3%, a difference of 0.010%), Sri Lankan (96.4%, a difference of 0.030%), Immigrants from Burma/Myanmar (96.3%, a difference of 0.040%), and Immigrants from Bangladesh (96.2%, a difference of 0.080%). Similarly, the demographic groups most similar to Hispanics or Latinos are Dominican (96.0%, a difference of 0.010%), Immigrants from Belize (96.0%, a difference of 0.020%), Immigrants from Nicaragua (96.0%, a difference of 0.030%), Japanese (96.0%, a difference of 0.050%), and Immigrants from Vietnam (96.0%, a difference of 0.050%).
| Demographics | Rating | Rank | 4th Grade |
| Sri Lankans | 0.0 /100 | #306 | Tragic 96.4% |
| Immigrants | Haiti | 0.0 /100 | #307 | Tragic 96.3% |
| Immigrants | Laos | 0.0 /100 | #308 | Tragic 96.3% |
| Immigrants | Guyana | 0.0 /100 | #309 | Tragic 96.3% |
| Immigrants | Burma/Myanmar | 0.0 /100 | #310 | Tragic 96.3% |
| Immigrants | Bangladesh | 0.0 /100 | #311 | Tragic 96.2% |
| Cape Verdeans | 0.0 /100 | #312 | Tragic 96.2% |
| Indonesians | 0.0 /100 | #313 | Tragic 96.2% |
| Vietnamese | 0.0 /100 | #314 | Tragic 96.2% |
| Nicaraguans | 0.0 /100 | #315 | Tragic 96.2% |
| Immigrants | Ecuador | 0.0 /100 | #316 | Tragic 96.2% |
| Central American Indians | 0.0 /100 | #317 | Tragic 96.2% |
| Immigrants | Azores | 0.0 /100 | #318 | Tragic 96.1% |
| Belizeans | 0.0 /100 | #319 | Tragic 96.1% |
| Bangladeshis | 0.0 /100 | #320 | Tragic 96.1% |
| Japanese | 0.0 /100 | #321 | Tragic 96.0% |
| Immigrants | Vietnam | 0.0 /100 | #322 | Tragic 96.0% |
| Immigrants | Nicaragua | 0.0 /100 | #323 | Tragic 96.0% |
| Immigrants | Belize | 0.0 /100 | #324 | Tragic 96.0% |
| Dominicans | 0.0 /100 | #325 | Tragic 96.0% |
| Hispanics or Latinos | 0.0 /100 | #326 | Tragic 96.0% |