Immigrants from Guatemala vs Haitian Male Poverty
COMPARE
Immigrants from Guatemala
Haitian
Male Poverty
Male Poverty Comparison
Immigrants from Guatemala
Haitians
14.0%
MALE POVERTY
0.0/ 100
METRIC RATING
299th/ 347
METRIC RANK
13.7%
MALE POVERTY
0.0/ 100
METRIC RATING
279th/ 347
METRIC RANK
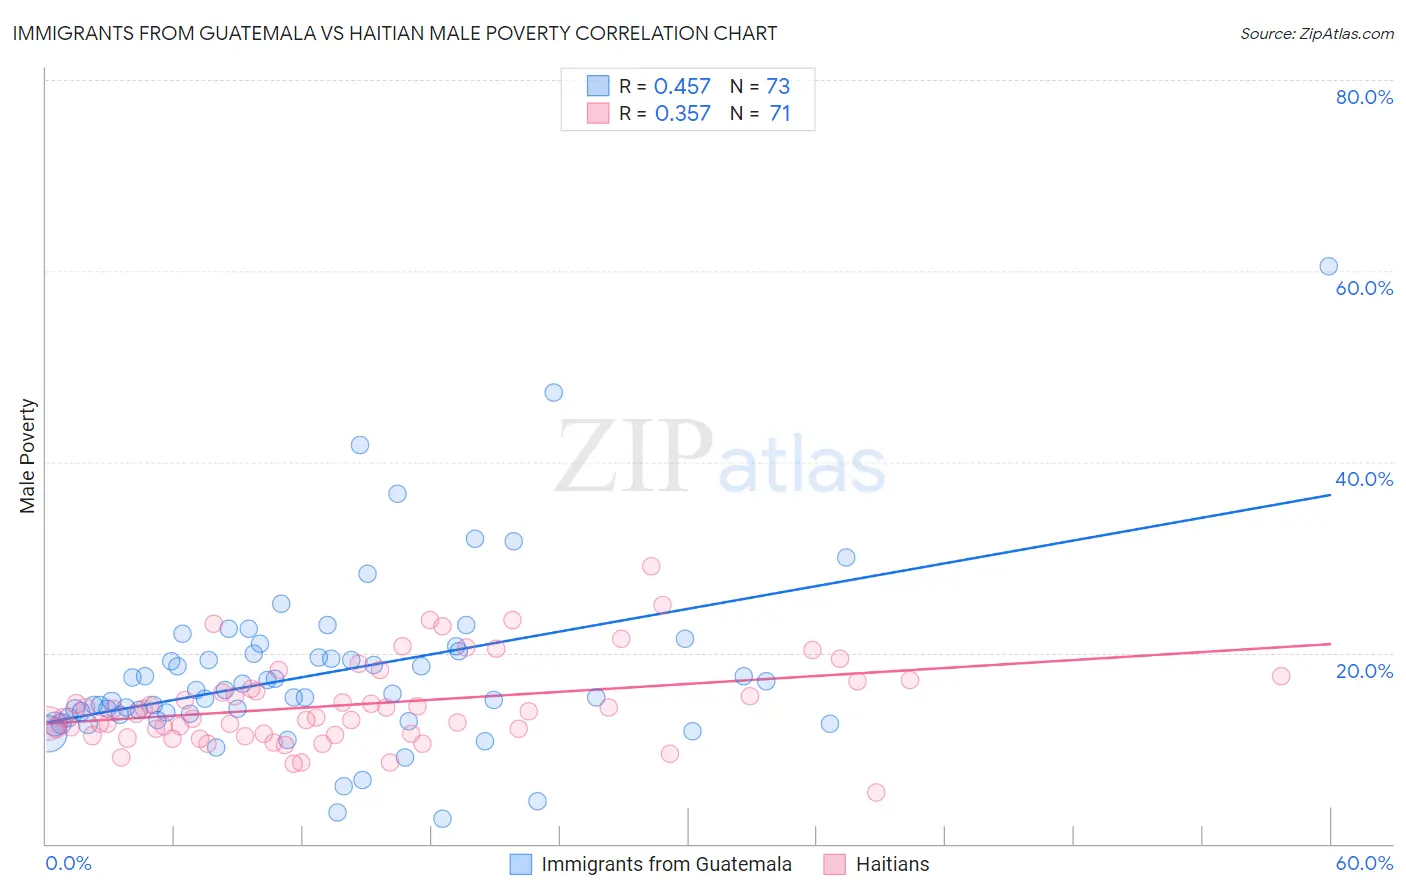
Immigrants from Guatemala vs Haitian Male Poverty Correlation Chart
The statistical analysis conducted on geographies consisting of 377,090,966 people shows a moderate positive correlation between the proportion of Immigrants from Guatemala and poverty level among males in the United States with a correlation coefficient (R) of 0.457 and weighted average of 14.0%. Similarly, the statistical analysis conducted on geographies consisting of 287,676,273 people shows a mild positive correlation between the proportion of Haitians and poverty level among males in the United States with a correlation coefficient (R) of 0.357 and weighted average of 13.7%, a difference of 2.5%.
Male Poverty Correlation Summary
| Measurement | Immigrants from Guatemala | Haitian |
| Minimum | 2.7% | 5.4% |
| Maximum | 60.5% | 29.1% |
| Range | 57.9% | 23.8% |
| Mean | 17.9% | 14.6% |
| Median | 15.7% | 13.7% |
| Interquartile 25% (IQ1) | 13.4% | 11.5% |
| Interquartile 75% (IQ3) | 20.1% | 17.1% |
| Interquartile Range (IQR) | 6.7% | 5.5% |
| Standard Deviation (Sample) | 9.2% | 4.5% |
| Standard Deviation (Population) | 9.1% | 4.4% |
Demographics Similar to Immigrants from Guatemala and Haitians by Male Poverty
In terms of male poverty, the demographic groups most similar to Immigrants from Guatemala are Blackfeet (14.0%, a difference of 0.10%), Inupiat (14.0%, a difference of 0.13%), Cajun (13.9%, a difference of 0.76%), Immigrants from Central America (13.9%, a difference of 0.88%), and Hispanic or Latino (13.9%, a difference of 1.2%). Similarly, the demographic groups most similar to Haitians are Mexican (13.7%, a difference of 0.090%), Yaqui (13.7%, a difference of 0.14%), Immigrants from Cabo Verde (13.7%, a difference of 0.41%), Comanche (13.8%, a difference of 0.62%), and Immigrants from Haiti (13.8%, a difference of 0.63%).
| Demographics | Rating | Rank | Male Poverty |
| Haitians | 0.0 /100 | #279 | Tragic 13.7% |
| Mexicans | 0.0 /100 | #280 | Tragic 13.7% |
| Yaqui | 0.0 /100 | #281 | Tragic 13.7% |
| Immigrants | Cabo Verde | 0.0 /100 | #282 | Tragic 13.7% |
| Comanche | 0.0 /100 | #283 | Tragic 13.8% |
| Immigrants | Haiti | 0.0 /100 | #284 | Tragic 13.8% |
| West Indians | 0.0 /100 | #285 | Tragic 13.8% |
| Shoshone | 0.0 /100 | #286 | Tragic 13.8% |
| Immigrants | Barbados | 0.0 /100 | #287 | Tragic 13.8% |
| Immigrants | St. Vincent and the Grenadines | 0.0 /100 | #288 | Tragic 13.8% |
| Guatemalans | 0.0 /100 | #289 | Tragic 13.8% |
| Immigrants | Zaire | 0.0 /100 | #290 | Tragic 13.8% |
| Vietnamese | 0.0 /100 | #291 | Tragic 13.8% |
| Indonesians | 0.0 /100 | #292 | Tragic 13.8% |
| Immigrants | Belize | 0.0 /100 | #293 | Tragic 13.8% |
| Hispanics or Latinos | 0.0 /100 | #294 | Tragic 13.9% |
| Immigrants | Central America | 0.0 /100 | #295 | Tragic 13.9% |
| Cajuns | 0.0 /100 | #296 | Tragic 13.9% |
| Inupiat | 0.0 /100 | #297 | Tragic 14.0% |
| Blackfeet | 0.0 /100 | #298 | Tragic 14.0% |
| Immigrants | Guatemala | 0.0 /100 | #299 | Tragic 14.0% |