Immigrants from Guatemala vs Serbian Male Poverty
COMPARE
Immigrants from Guatemala
Serbian
Male Poverty
Male Poverty Comparison
Immigrants from Guatemala
Serbians
14.0%
MALE POVERTY
0.0/ 100
METRIC RATING
299th/ 347
METRIC RANK
10.2%
MALE POVERTY
97.5/ 100
METRIC RATING
66th/ 347
METRIC RANK
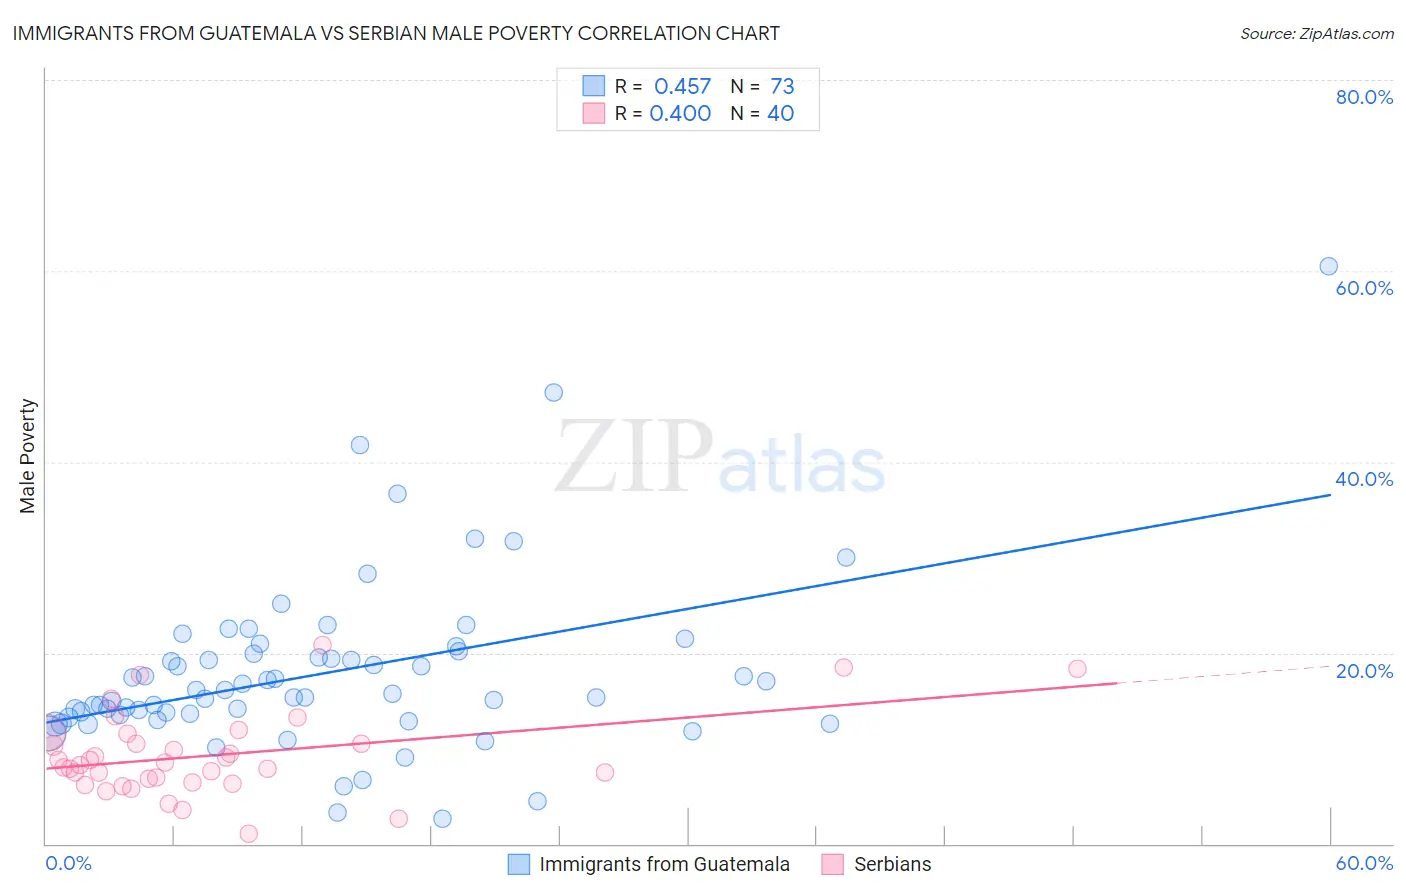
Immigrants from Guatemala vs Serbian Male Poverty Correlation Chart
The statistical analysis conducted on geographies consisting of 377,090,966 people shows a moderate positive correlation between the proportion of Immigrants from Guatemala and poverty level among males in the United States with a correlation coefficient (R) of 0.457 and weighted average of 14.0%. Similarly, the statistical analysis conducted on geographies consisting of 267,465,606 people shows a mild positive correlation between the proportion of Serbians and poverty level among males in the United States with a correlation coefficient (R) of 0.400 and weighted average of 10.2%, a difference of 37.6%.
Male Poverty Correlation Summary
| Measurement | Immigrants from Guatemala | Serbian |
| Minimum | 2.7% | 1.0% |
| Maximum | 60.5% | 20.8% |
| Range | 57.9% | 19.8% |
| Mean | 17.9% | 9.3% |
| Median | 15.7% | 8.4% |
| Interquartile 25% (IQ1) | 13.4% | 6.6% |
| Interquartile 75% (IQ3) | 20.1% | 11.0% |
| Interquartile Range (IQR) | 6.7% | 4.4% |
| Standard Deviation (Sample) | 9.2% | 4.3% |
| Standard Deviation (Population) | 9.1% | 4.3% |
Similar Demographics by Male Poverty
Demographics Similar to Immigrants from Guatemala by Male Poverty
In terms of male poverty, the demographic groups most similar to Immigrants from Guatemala are Blackfeet (14.0%, a difference of 0.10%), Immigrants from Mexico (14.0%, a difference of 0.12%), Inupiat (14.0%, a difference of 0.13%), Immigrants from Senegal (14.0%, a difference of 0.18%), and Immigrants from Caribbean (14.0%, a difference of 0.24%).
| Demographics | Rating | Rank | Male Poverty |
| Indonesians | 0.0 /100 | #292 | Tragic 13.8% |
| Immigrants | Belize | 0.0 /100 | #293 | Tragic 13.8% |
| Hispanics or Latinos | 0.0 /100 | #294 | Tragic 13.9% |
| Immigrants | Central America | 0.0 /100 | #295 | Tragic 13.9% |
| Cajuns | 0.0 /100 | #296 | Tragic 13.9% |
| Inupiat | 0.0 /100 | #297 | Tragic 14.0% |
| Blackfeet | 0.0 /100 | #298 | Tragic 14.0% |
| Immigrants | Guatemala | 0.0 /100 | #299 | Tragic 14.0% |
| Immigrants | Mexico | 0.0 /100 | #300 | Tragic 14.0% |
| Immigrants | Senegal | 0.0 /100 | #301 | Tragic 14.0% |
| Immigrants | Caribbean | 0.0 /100 | #302 | Tragic 14.0% |
| Bahamians | 0.0 /100 | #303 | Tragic 14.1% |
| Senegalese | 0.0 /100 | #304 | Tragic 14.1% |
| Immigrants | Bangladesh | 0.0 /100 | #305 | Tragic 14.1% |
| Creek | 0.0 /100 | #306 | Tragic 14.1% |
Demographics Similar to Serbians by Male Poverty
In terms of male poverty, the demographic groups most similar to Serbians are Zimbabwean (10.2%, a difference of 0.010%), Swiss (10.2%, a difference of 0.080%), Immigrants from Netherlands (10.2%, a difference of 0.17%), Immigrants from Sri Lanka (10.2%, a difference of 0.22%), and Slovak (10.2%, a difference of 0.31%).
| Demographics | Rating | Rank | Male Poverty |
| Immigrants | Europe | 97.9 /100 | #59 | Exceptional 10.1% |
| Ukrainians | 97.9 /100 | #60 | Exceptional 10.1% |
| Austrians | 97.8 /100 | #61 | Exceptional 10.1% |
| Immigrants | Italy | 97.8 /100 | #62 | Exceptional 10.2% |
| Slovaks | 97.7 /100 | #63 | Exceptional 10.2% |
| Swiss | 97.5 /100 | #64 | Exceptional 10.2% |
| Zimbabweans | 97.5 /100 | #65 | Exceptional 10.2% |
| Serbians | 97.5 /100 | #66 | Exceptional 10.2% |
| Immigrants | Netherlands | 97.3 /100 | #67 | Exceptional 10.2% |
| Immigrants | Sri Lanka | 97.2 /100 | #68 | Exceptional 10.2% |
| Immigrants | Australia | 97.1 /100 | #69 | Exceptional 10.2% |
| Paraguayans | 97.1 /100 | #70 | Exceptional 10.2% |
| Europeans | 97.1 /100 | #71 | Exceptional 10.2% |
| Immigrants | Canada | 97.1 /100 | #72 | Exceptional 10.2% |
| Immigrants | Asia | 97.0 /100 | #73 | Exceptional 10.2% |