Immigrants from Guatemala vs Cree Single Mother Poverty
COMPARE
Immigrants from Guatemala
Cree
Single Mother Poverty
Single Mother Poverty Comparison
Immigrants from Guatemala
Cree
33.3%
SINGLE MOTHER POVERTY
0.0/ 100
METRIC RATING
299th/ 347
METRIC RANK
32.2%
SINGLE MOTHER POVERTY
0.0/ 100
METRIC RATING
281st/ 347
METRIC RANK
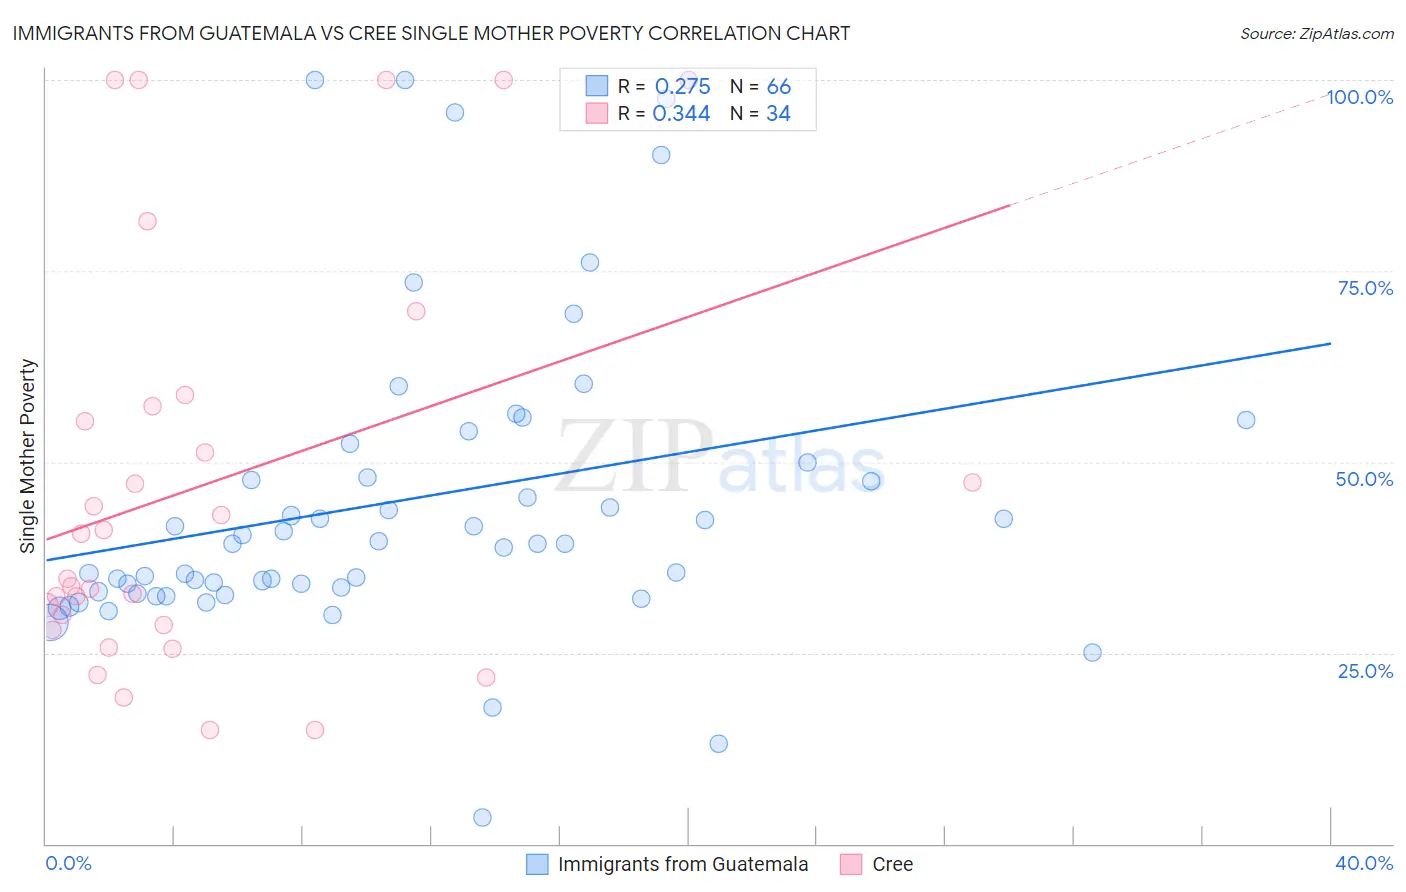
Immigrants from Guatemala vs Cree Single Mother Poverty Correlation Chart
The statistical analysis conducted on geographies consisting of 371,171,029 people shows a weak positive correlation between the proportion of Immigrants from Guatemala and poverty level among single mothers in the United States with a correlation coefficient (R) of 0.275 and weighted average of 33.3%. Similarly, the statistical analysis conducted on geographies consisting of 75,775,779 people shows a mild positive correlation between the proportion of Cree and poverty level among single mothers in the United States with a correlation coefficient (R) of 0.344 and weighted average of 32.2%, a difference of 3.5%.
Single Mother Poverty Correlation Summary
| Measurement | Immigrants from Guatemala | Cree |
| Minimum | 3.4% | 14.9% |
| Maximum | 100.0% | 100.0% |
| Range | 96.6% | 85.1% |
| Mean | 45.0% | 47.0% |
| Median | 39.3% | 37.6% |
| Interquartile 25% (IQ1) | 33.0% | 28.6% |
| Interquartile 75% (IQ3) | 50.0% | 57.4% |
| Interquartile Range (IQR) | 17.0% | 28.8% |
| Standard Deviation (Sample) | 20.7% | 26.7% |
| Standard Deviation (Population) | 20.5% | 26.3% |
Demographics Similar to Immigrants from Guatemala and Cree by Single Mother Poverty
In terms of single mother poverty, the demographic groups most similar to Immigrants from Guatemala are Hispanic or Latino (33.3%, a difference of 0.0%), African (33.3%, a difference of 0.090%), Pennsylvania German (33.2%, a difference of 0.20%), Blackfeet (33.2%, a difference of 0.34%), and Yaqui (33.1%, a difference of 0.50%). Similarly, the demographic groups most similar to Cree are Nonimmigrants (32.2%, a difference of 0.030%), Immigrants from the Azores (32.2%, a difference of 0.11%), Spanish American (32.3%, a difference of 0.36%), Indonesian (32.4%, a difference of 0.66%), and Immigrants from Latin America (32.4%, a difference of 0.77%).
| Demographics | Rating | Rank | Single Mother Poverty |
| Immigrants | Nonimmigrants | 0.0 /100 | #280 | Tragic 32.2% |
| Cree | 0.0 /100 | #281 | Tragic 32.2% |
| Immigrants | Azores | 0.0 /100 | #282 | Tragic 32.2% |
| Spanish Americans | 0.0 /100 | #283 | Tragic 32.3% |
| Indonesians | 0.0 /100 | #284 | Tragic 32.4% |
| Immigrants | Latin America | 0.0 /100 | #285 | Tragic 32.4% |
| Yup'ik | 0.0 /100 | #286 | Tragic 32.5% |
| Immigrants | Dominica | 0.0 /100 | #287 | Tragic 32.5% |
| Somalis | 0.0 /100 | #288 | Tragic 32.6% |
| U.S. Virgin Islanders | 0.0 /100 | #289 | Tragic 32.6% |
| Osage | 0.0 /100 | #290 | Tragic 32.6% |
| Guatemalans | 0.0 /100 | #291 | Tragic 32.9% |
| Shoshone | 0.0 /100 | #292 | Tragic 32.9% |
| Aleuts | 0.0 /100 | #293 | Tragic 32.9% |
| French American Indians | 0.0 /100 | #294 | Tragic 33.1% |
| Yaqui | 0.0 /100 | #295 | Tragic 33.1% |
| Blackfeet | 0.0 /100 | #296 | Tragic 33.2% |
| Pennsylvania Germans | 0.0 /100 | #297 | Tragic 33.2% |
| Africans | 0.0 /100 | #298 | Tragic 33.3% |
| Immigrants | Guatemala | 0.0 /100 | #299 | Tragic 33.3% |
| Hispanics or Latinos | 0.0 /100 | #300 | Tragic 33.3% |