Immigrants from Grenada vs Assyrian/Chaldean/Syriac Poverty
COMPARE
Immigrants from Grenada
Assyrian/Chaldean/Syriac
Poverty
Poverty Comparison
Immigrants from Grenada
Assyrians/Chaldeans/Syriacs
15.8%
POVERTY
0.0/ 100
METRIC RATING
313th/ 347
METRIC RANK
10.1%
POVERTY
99.9/ 100
METRIC RATING
6th/ 347
METRIC RANK
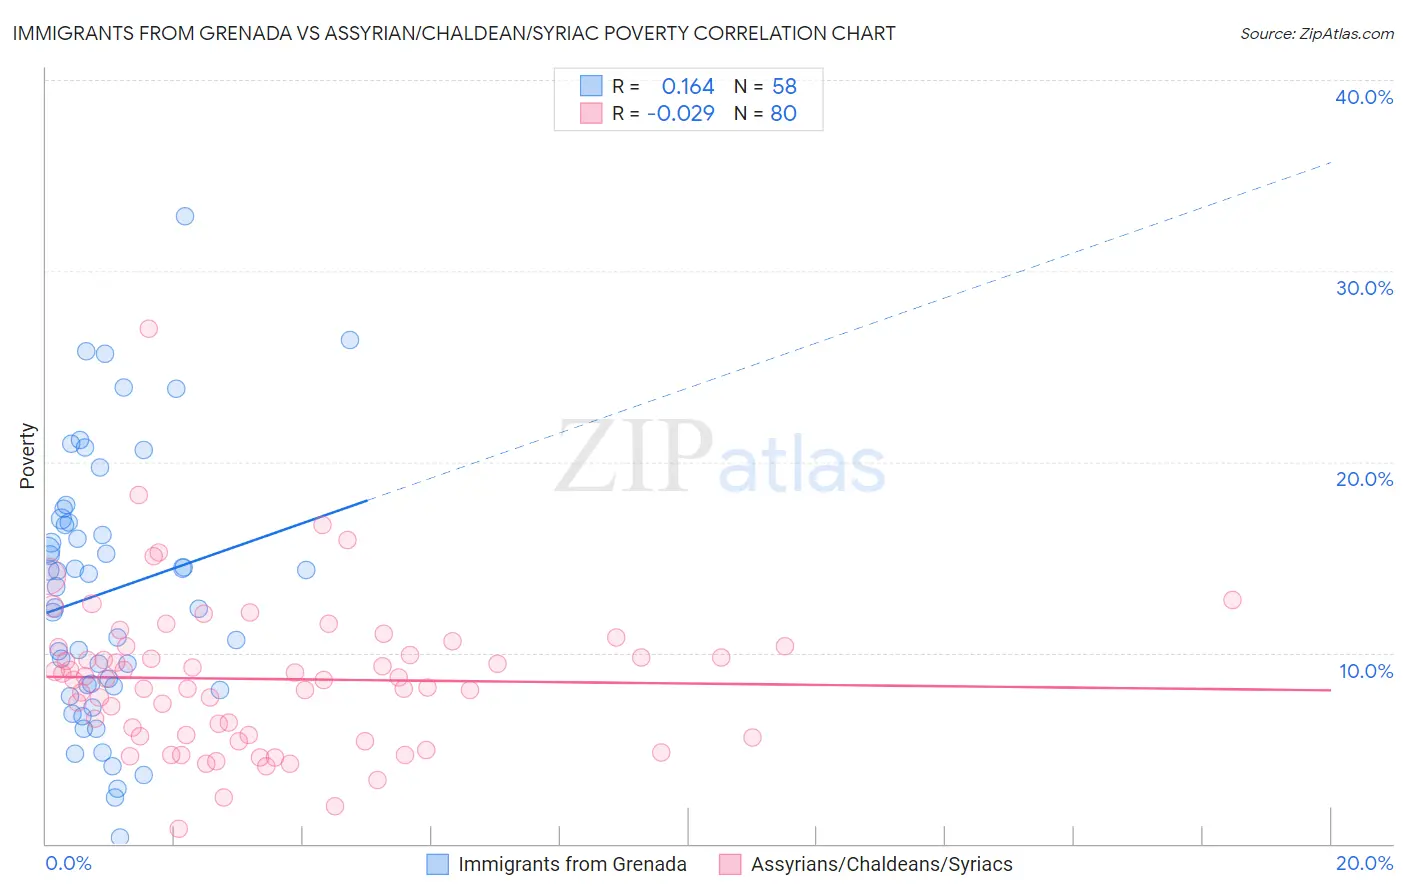
Immigrants from Grenada vs Assyrian/Chaldean/Syriac Poverty Correlation Chart
The statistical analysis conducted on geographies consisting of 67,200,374 people shows a poor positive correlation between the proportion of Immigrants from Grenada and poverty level in the United States with a correlation coefficient (R) of 0.164 and weighted average of 15.8%. Similarly, the statistical analysis conducted on geographies consisting of 110,294,236 people shows no correlation between the proportion of Assyrians/Chaldeans/Syriacs and poverty level in the United States with a correlation coefficient (R) of -0.029 and weighted average of 10.1%, a difference of 56.2%.
Poverty Correlation Summary
| Measurement | Immigrants from Grenada | Assyrian/Chaldean/Syriac |
| Minimum | 0.33% | 0.75% |
| Maximum | 32.9% | 27.0% |
| Range | 32.6% | 26.2% |
| Mean | 13.2% | 8.6% |
| Median | 13.8% | 8.6% |
| Interquartile 25% (IQ1) | 8.2% | 5.7% |
| Interquartile 75% (IQ3) | 16.8% | 10.3% |
| Interquartile Range (IQR) | 8.6% | 4.6% |
| Standard Deviation (Sample) | 6.8% | 4.0% |
| Standard Deviation (Population) | 6.8% | 4.0% |
Similar Demographics by Poverty
Demographics Similar to Immigrants from Grenada by Poverty
In terms of poverty, the demographic groups most similar to Immigrants from Grenada are Immigrants from Somalia (15.8%, a difference of 0.12%), Cajun (15.7%, a difference of 0.44%), British West Indian (15.9%, a difference of 0.49%), Honduran (15.9%, a difference of 0.49%), and Chippewa (15.7%, a difference of 0.60%).
| Demographics | Rating | Rank | Poverty |
| Creek | 0.0 /100 | #306 | Tragic 15.6% |
| Africans | 0.0 /100 | #307 | Tragic 15.6% |
| Choctaw | 0.0 /100 | #308 | Tragic 15.6% |
| Seminole | 0.0 /100 | #309 | Tragic 15.6% |
| Dutch West Indians | 0.0 /100 | #310 | Tragic 15.6% |
| Chippewa | 0.0 /100 | #311 | Tragic 15.7% |
| Cajuns | 0.0 /100 | #312 | Tragic 15.7% |
| Immigrants | Grenada | 0.0 /100 | #313 | Tragic 15.8% |
| Immigrants | Somalia | 0.0 /100 | #314 | Tragic 15.8% |
| British West Indians | 0.0 /100 | #315 | Tragic 15.9% |
| Hondurans | 0.0 /100 | #316 | Tragic 15.9% |
| U.S. Virgin Islanders | 0.0 /100 | #317 | Tragic 16.1% |
| Immigrants | Dominica | 0.0 /100 | #318 | Tragic 16.1% |
| Immigrants | Congo | 0.0 /100 | #319 | Tragic 16.1% |
| Immigrants | Honduras | 0.0 /100 | #320 | Tragic 16.2% |
Demographics Similar to Assyrians/Chaldeans/Syriacs by Poverty
In terms of poverty, the demographic groups most similar to Assyrians/Chaldeans/Syriacs are Filipino (10.1%, a difference of 0.14%), Immigrants from Ireland (10.1%, a difference of 0.18%), Maltese (10.2%, a difference of 0.56%), Immigrants from South Central Asia (10.2%, a difference of 1.0%), and Bulgarian (10.2%, a difference of 1.4%).
| Demographics | Rating | Rank | Poverty |
| Immigrants | India | 100.0 /100 | #1 | Exceptional 9.0% |
| Chinese | 100.0 /100 | #2 | Exceptional 9.5% |
| Thais | 100.0 /100 | #3 | Exceptional 9.6% |
| Immigrants | Taiwan | 100.0 /100 | #4 | Exceptional 9.7% |
| Immigrants | Ireland | 99.9 /100 | #5 | Exceptional 10.1% |
| Assyrians/Chaldeans/Syriacs | 99.9 /100 | #6 | Exceptional 10.1% |
| Filipinos | 99.9 /100 | #7 | Exceptional 10.1% |
| Maltese | 99.9 /100 | #8 | Exceptional 10.2% |
| Immigrants | South Central Asia | 99.9 /100 | #9 | Exceptional 10.2% |
| Bulgarians | 99.9 /100 | #10 | Exceptional 10.2% |
| Immigrants | Lithuania | 99.9 /100 | #11 | Exceptional 10.3% |
| Bhutanese | 99.8 /100 | #12 | Exceptional 10.4% |
| Immigrants | Hong Kong | 99.8 /100 | #13 | Exceptional 10.4% |
| Immigrants | Bolivia | 99.8 /100 | #14 | Exceptional 10.4% |
| Bolivians | 99.8 /100 | #15 | Exceptional 10.4% |