Immigrants from Greece vs Scandinavian Child Poverty Among Girls Under 16
COMPARE
Immigrants from Greece
Scandinavian
Child Poverty Among Girls Under 16
Child Poverty Among Girls Under 16 Comparison
Immigrants from Greece
Scandinavians
14.1%
CHILD POVERTY AMONG GIRLS UNDER 16
99.3/ 100
METRIC RATING
45th/ 347
METRIC RANK
14.4%
CHILD POVERTY AMONG GIRLS UNDER 16
98.7/ 100
METRIC RATING
62nd/ 347
METRIC RANK
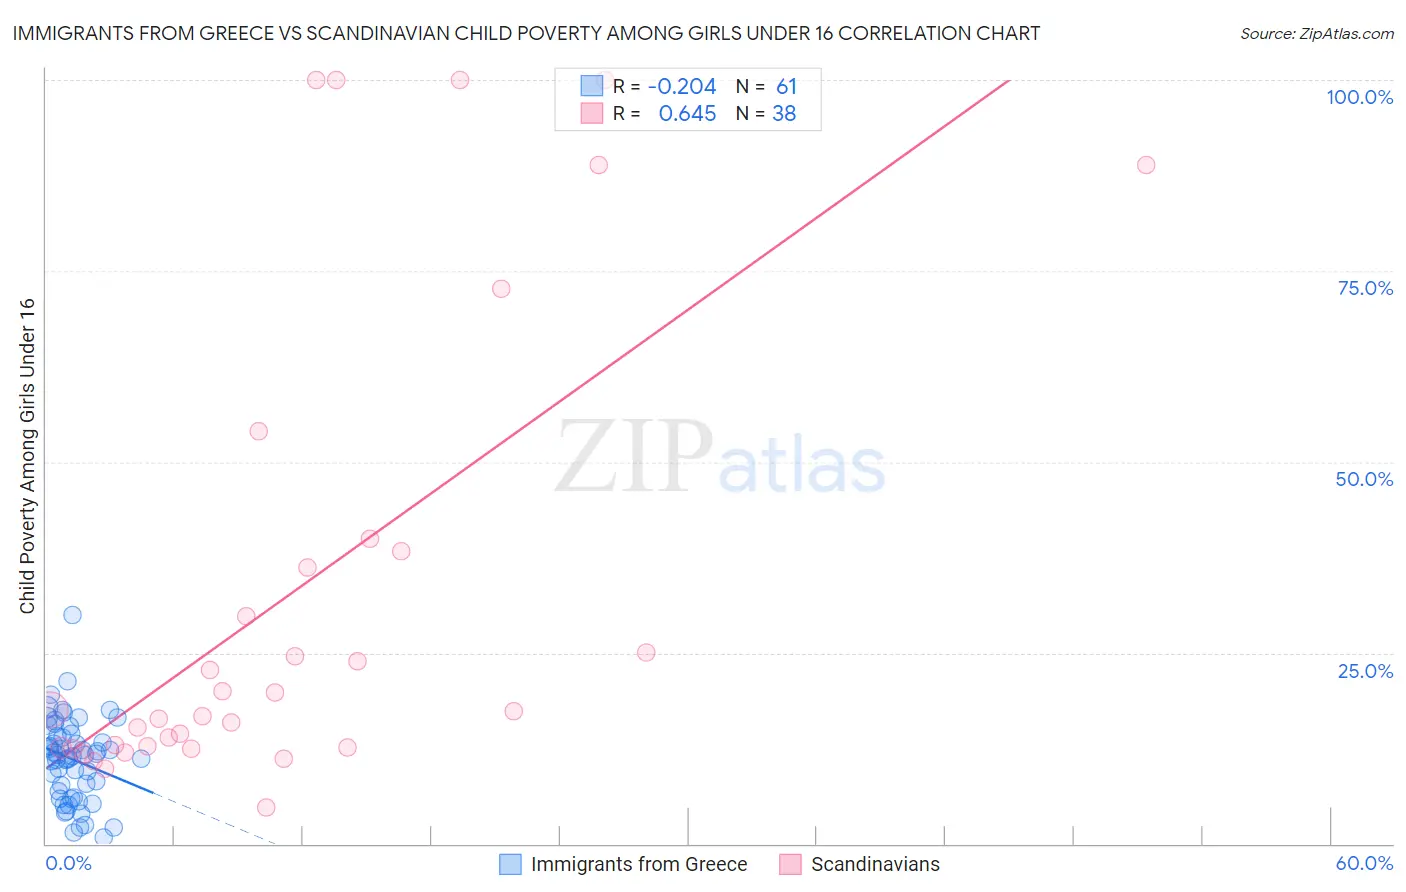
Immigrants from Greece vs Scandinavian Child Poverty Among Girls Under 16 Correlation Chart
The statistical analysis conducted on geographies consisting of 213,202,759 people shows a weak negative correlation between the proportion of Immigrants from Greece and poverty level among girls under the age of 16 in the United States with a correlation coefficient (R) of -0.204 and weighted average of 14.1%. Similarly, the statistical analysis conducted on geographies consisting of 459,652,874 people shows a significant positive correlation between the proportion of Scandinavians and poverty level among girls under the age of 16 in the United States with a correlation coefficient (R) of 0.645 and weighted average of 14.4%, a difference of 2.0%.
Child Poverty Among Girls Under 16 Correlation Summary
| Measurement | Immigrants from Greece | Scandinavian |
| Minimum | 0.79% | 4.8% |
| Maximum | 29.9% | 100.0% |
| Range | 29.1% | 95.2% |
| Mean | 11.1% | 32.8% |
| Median | 11.6% | 17.5% |
| Interquartile 25% (IQ1) | 6.4% | 12.7% |
| Interquartile 75% (IQ3) | 14.3% | 38.4% |
| Interquartile Range (IQR) | 7.9% | 25.7% |
| Standard Deviation (Sample) | 5.4% | 30.8% |
| Standard Deviation (Population) | 5.4% | 30.4% |
Demographics Similar to Immigrants from Greece and Scandinavians by Child Poverty Among Girls Under 16
In terms of child poverty among girls under 16, the demographic groups most similar to Immigrants from Greece are Croatian (14.1%, a difference of 0.030%), Immigrants from Czechoslovakia (14.2%, a difference of 0.060%), Czech (14.2%, a difference of 0.070%), Greek (14.2%, a difference of 0.11%), and Immigrants from Israel (14.2%, a difference of 0.18%). Similarly, the demographic groups most similar to Scandinavians are Immigrants from Europe (14.4%, a difference of 0.050%), Cambodian (14.4%, a difference of 0.11%), Polish (14.4%, a difference of 0.12%), Zimbabwean (14.4%, a difference of 0.31%), and Immigrants from Bulgaria (14.4%, a difference of 0.37%).
| Demographics | Rating | Rank | Child Poverty Among Girls Under 16 |
| Koreans | 99.4 /100 | #43 | Exceptional 14.1% |
| Immigrants | Asia | 99.4 /100 | #44 | Exceptional 14.1% |
| Immigrants | Greece | 99.3 /100 | #45 | Exceptional 14.1% |
| Croatians | 99.3 /100 | #46 | Exceptional 14.1% |
| Immigrants | Czechoslovakia | 99.3 /100 | #47 | Exceptional 14.2% |
| Czechs | 99.3 /100 | #48 | Exceptional 14.2% |
| Greeks | 99.2 /100 | #49 | Exceptional 14.2% |
| Immigrants | Israel | 99.2 /100 | #50 | Exceptional 14.2% |
| Immigrants | Pakistan | 99.1 /100 | #51 | Exceptional 14.2% |
| Italians | 99.1 /100 | #52 | Exceptional 14.3% |
| Luxembourgers | 99.0 /100 | #53 | Exceptional 14.3% |
| Estonians | 98.9 /100 | #54 | Exceptional 14.3% |
| Immigrants | Romania | 98.9 /100 | #55 | Exceptional 14.3% |
| Immigrants | Indonesia | 98.9 /100 | #56 | Exceptional 14.4% |
| Immigrants | Serbia | 98.9 /100 | #57 | Exceptional 14.4% |
| Immigrants | Bulgaria | 98.8 /100 | #58 | Exceptional 14.4% |
| Zimbabweans | 98.8 /100 | #59 | Exceptional 14.4% |
| Poles | 98.7 /100 | #60 | Exceptional 14.4% |
| Cambodians | 98.7 /100 | #61 | Exceptional 14.4% |
| Scandinavians | 98.7 /100 | #62 | Exceptional 14.4% |
| Immigrants | Europe | 98.7 /100 | #63 | Exceptional 14.4% |