Immigrants from Greece vs Tongan Single Mother Poverty
COMPARE
Immigrants from Greece
Tongan
Single Mother Poverty
Single Mother Poverty Comparison
Immigrants from Greece
Tongans
26.7%
SINGLE MOTHER POVERTY
99.9/ 100
METRIC RATING
41st/ 347
METRIC RANK
26.5%
SINGLE MOTHER POVERTY
99.9/ 100
METRIC RATING
32nd/ 347
METRIC RANK
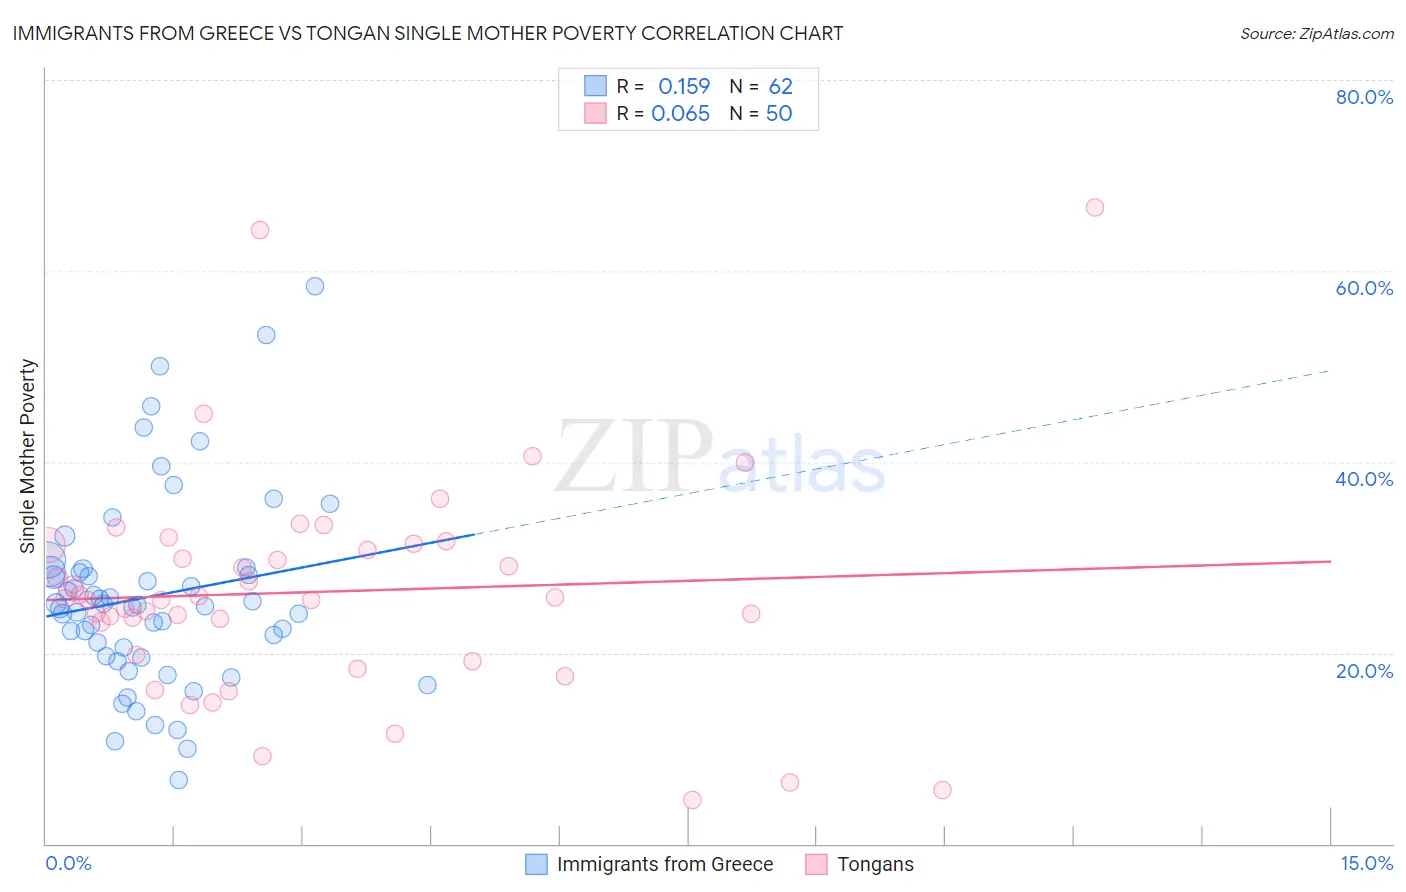
Immigrants from Greece vs Tongan Single Mother Poverty Correlation Chart
The statistical analysis conducted on geographies consisting of 212,076,443 people shows a poor positive correlation between the proportion of Immigrants from Greece and poverty level among single mothers in the United States with a correlation coefficient (R) of 0.159 and weighted average of 26.7%. Similarly, the statistical analysis conducted on geographies consisting of 102,184,509 people shows a slight positive correlation between the proportion of Tongans and poverty level among single mothers in the United States with a correlation coefficient (R) of 0.065 and weighted average of 26.5%, a difference of 0.76%.
Single Mother Poverty Correlation Summary
| Measurement | Immigrants from Greece | Tongan |
| Minimum | 6.7% | 4.6% |
| Maximum | 58.3% | 66.7% |
| Range | 51.6% | 62.1% |
| Mean | 25.9% | 26.4% |
| Median | 24.9% | 25.6% |
| Interquartile 25% (IQ1) | 19.6% | 19.8% |
| Interquartile 75% (IQ3) | 28.5% | 31.3% |
| Interquartile Range (IQR) | 8.9% | 11.5% |
| Standard Deviation (Sample) | 10.2% | 11.8% |
| Standard Deviation (Population) | 10.1% | 11.7% |
Demographics Similar to Immigrants from Greece and Tongans by Single Mother Poverty
In terms of single mother poverty, the demographic groups most similar to Immigrants from Greece are Immigrants from Vietnam (26.7%, a difference of 0.070%), Sri Lankan (26.7%, a difference of 0.17%), Armenian (26.8%, a difference of 0.23%), Tsimshian (26.8%, a difference of 0.31%), and Immigrants from Sierra Leone (26.9%, a difference of 0.45%). Similarly, the demographic groups most similar to Tongans are Bulgarian (26.5%, a difference of 0.040%), Immigrants from Indonesia (26.6%, a difference of 0.050%), Maltese (26.6%, a difference of 0.17%), Okinawan (26.6%, a difference of 0.21%), and Immigrants from Israel (26.6%, a difference of 0.22%).
| Demographics | Rating | Rank | Single Mother Poverty |
| Immigrants | Sri Lanka | 100.0 /100 | #26 | Exceptional 26.3% |
| Immigrants | Japan | 100.0 /100 | #27 | Exceptional 26.4% |
| Koreans | 100.0 /100 | #28 | Exceptional 26.4% |
| Jordanians | 100.0 /100 | #29 | Exceptional 26.4% |
| Turks | 100.0 /100 | #30 | Exceptional 26.4% |
| Immigrants | Philippines | 100.0 /100 | #31 | Exceptional 26.5% |
| Tongans | 99.9 /100 | #32 | Exceptional 26.5% |
| Bulgarians | 99.9 /100 | #33 | Exceptional 26.5% |
| Immigrants | Indonesia | 99.9 /100 | #34 | Exceptional 26.6% |
| Maltese | 99.9 /100 | #35 | Exceptional 26.6% |
| Okinawans | 99.9 /100 | #36 | Exceptional 26.6% |
| Immigrants | Israel | 99.9 /100 | #37 | Exceptional 26.6% |
| Immigrants | Fiji | 99.9 /100 | #38 | Exceptional 26.6% |
| Sri Lankans | 99.9 /100 | #39 | Exceptional 26.7% |
| Immigrants | Vietnam | 99.9 /100 | #40 | Exceptional 26.7% |
| Immigrants | Greece | 99.9 /100 | #41 | Exceptional 26.7% |
| Armenians | 99.9 /100 | #42 | Exceptional 26.8% |
| Tsimshian | 99.9 /100 | #43 | Exceptional 26.8% |
| Immigrants | Sierra Leone | 99.9 /100 | #44 | Exceptional 26.9% |
| Latvians | 99.9 /100 | #45 | Exceptional 26.9% |
| Immigrants | Serbia | 99.9 /100 | #46 | Exceptional 26.9% |