Immigrants from Greece vs Immigrants from Northern Europe Single Mother Poverty
COMPARE
Immigrants from Greece
Immigrants from Northern Europe
Single Mother Poverty
Single Mother Poverty Comparison
Immigrants from Greece
Immigrants from Northern Europe
26.7%
SINGLE MOTHER POVERTY
99.9/ 100
METRIC RATING
41st/ 347
METRIC RANK
27.3%
SINGLE MOTHER POVERTY
99.5/ 100
METRIC RATING
63rd/ 347
METRIC RANK
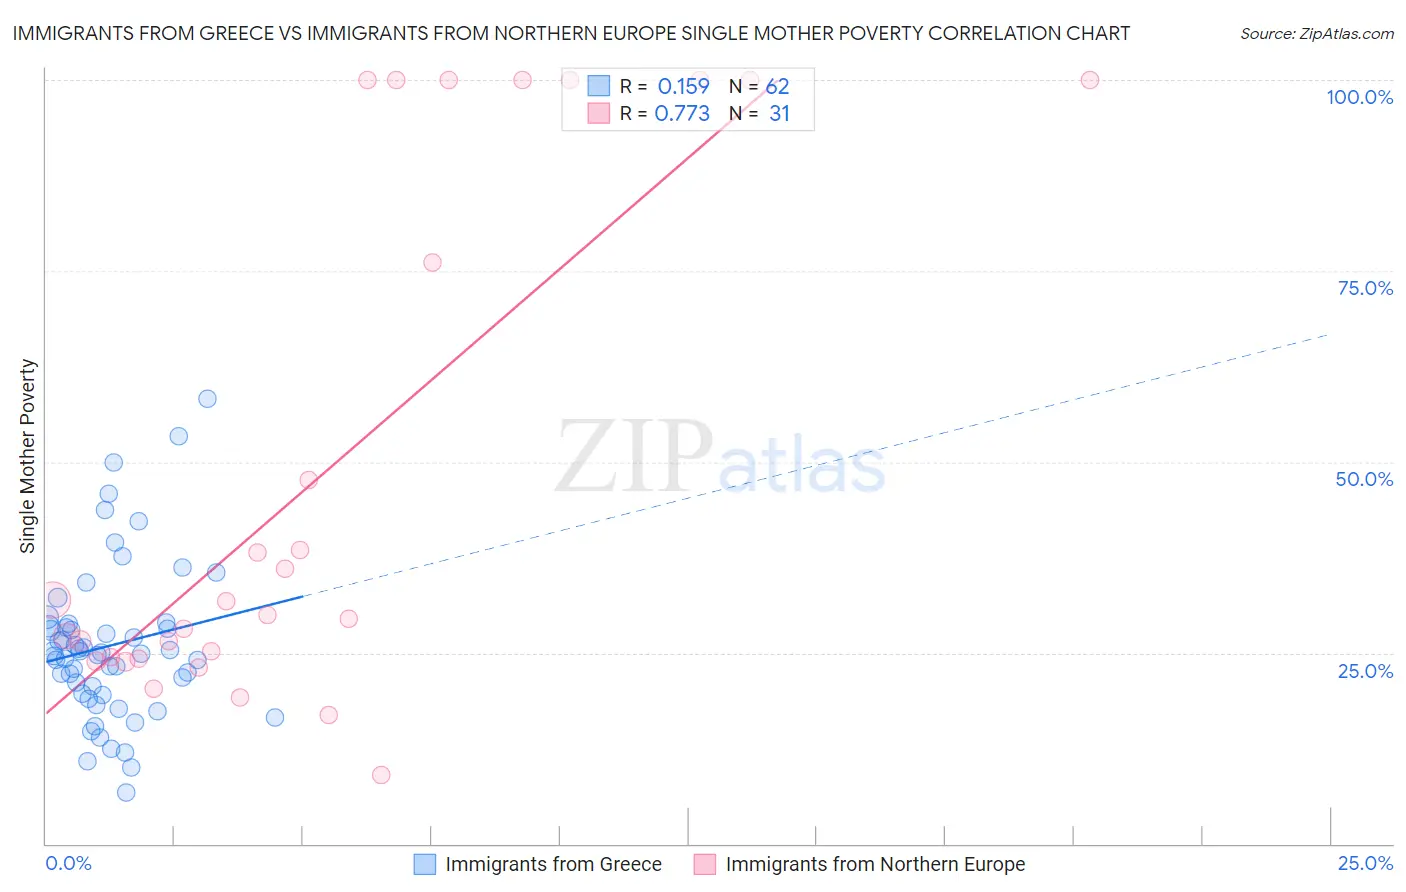
Immigrants from Greece vs Immigrants from Northern Europe Single Mother Poverty Correlation Chart
The statistical analysis conducted on geographies consisting of 212,076,443 people shows a poor positive correlation between the proportion of Immigrants from Greece and poverty level among single mothers in the United States with a correlation coefficient (R) of 0.159 and weighted average of 26.7%. Similarly, the statistical analysis conducted on geographies consisting of 459,610,123 people shows a strong positive correlation between the proportion of Immigrants from Northern Europe and poverty level among single mothers in the United States with a correlation coefficient (R) of 0.773 and weighted average of 27.3%, a difference of 2.1%.
Single Mother Poverty Correlation Summary
| Measurement | Immigrants from Greece | Immigrants from Northern Europe |
| Minimum | 6.7% | 9.1% |
| Maximum | 58.3% | 100.0% |
| Range | 51.6% | 90.9% |
| Mean | 25.9% | 47.7% |
| Median | 24.9% | 29.9% |
| Interquartile 25% (IQ1) | 19.6% | 24.2% |
| Interquartile 75% (IQ3) | 28.5% | 100.0% |
| Interquartile Range (IQR) | 8.9% | 75.8% |
| Standard Deviation (Sample) | 10.2% | 33.3% |
| Standard Deviation (Population) | 10.1% | 32.7% |
Similar Demographics by Single Mother Poverty
Demographics Similar to Immigrants from Greece by Single Mother Poverty
In terms of single mother poverty, the demographic groups most similar to Immigrants from Greece are Immigrants from Vietnam (26.7%, a difference of 0.070%), Sri Lankan (26.7%, a difference of 0.17%), Armenian (26.8%, a difference of 0.23%), Tsimshian (26.8%, a difference of 0.31%), and Immigrants from Sierra Leone (26.9%, a difference of 0.45%).
| Demographics | Rating | Rank | Single Mother Poverty |
| Immigrants | Indonesia | 99.9 /100 | #34 | Exceptional 26.6% |
| Maltese | 99.9 /100 | #35 | Exceptional 26.6% |
| Okinawans | 99.9 /100 | #36 | Exceptional 26.6% |
| Immigrants | Israel | 99.9 /100 | #37 | Exceptional 26.6% |
| Immigrants | Fiji | 99.9 /100 | #38 | Exceptional 26.6% |
| Sri Lankans | 99.9 /100 | #39 | Exceptional 26.7% |
| Immigrants | Vietnam | 99.9 /100 | #40 | Exceptional 26.7% |
| Immigrants | Greece | 99.9 /100 | #41 | Exceptional 26.7% |
| Armenians | 99.9 /100 | #42 | Exceptional 26.8% |
| Tsimshian | 99.9 /100 | #43 | Exceptional 26.8% |
| Immigrants | Sierra Leone | 99.9 /100 | #44 | Exceptional 26.9% |
| Latvians | 99.9 /100 | #45 | Exceptional 26.9% |
| Immigrants | Serbia | 99.9 /100 | #46 | Exceptional 26.9% |
| Egyptians | 99.8 /100 | #47 | Exceptional 26.9% |
| Immigrants | Poland | 99.8 /100 | #48 | Exceptional 26.9% |
Demographics Similar to Immigrants from Northern Europe by Single Mother Poverty
In terms of single mother poverty, the demographic groups most similar to Immigrants from Northern Europe are Russian (27.3%, a difference of 0.030%), Immigrants from Malaysia (27.3%, a difference of 0.050%), Immigrants from Turkey (27.3%, a difference of 0.11%), Soviet Union (27.3%, a difference of 0.15%), and Immigrants from Australia (27.3%, a difference of 0.17%).
| Demographics | Rating | Rank | Single Mother Poverty |
| Immigrants | Romania | 99.7 /100 | #56 | Exceptional 27.2% |
| Palestinians | 99.7 /100 | #57 | Exceptional 27.2% |
| Argentineans | 99.6 /100 | #58 | Exceptional 27.2% |
| Paraguayans | 99.6 /100 | #59 | Exceptional 27.2% |
| Eastern Europeans | 99.6 /100 | #60 | Exceptional 27.2% |
| Immigrants | Eastern Europe | 99.6 /100 | #61 | Exceptional 27.2% |
| Immigrants | Malaysia | 99.5 /100 | #62 | Exceptional 27.3% |
| Immigrants | Northern Europe | 99.5 /100 | #63 | Exceptional 27.3% |
| Russians | 99.5 /100 | #64 | Exceptional 27.3% |
| Immigrants | Turkey | 99.5 /100 | #65 | Exceptional 27.3% |
| Soviet Union | 99.5 /100 | #66 | Exceptional 27.3% |
| Immigrants | Australia | 99.5 /100 | #67 | Exceptional 27.3% |
| Immigrants | Czechoslovakia | 99.5 /100 | #68 | Exceptional 27.4% |
| Lithuanians | 99.4 /100 | #69 | Exceptional 27.4% |
| Immigrants | Belarus | 99.4 /100 | #70 | Exceptional 27.4% |