Immigrants from Greece vs English 7th Grade
COMPARE
Immigrants from Greece
English
7th Grade
7th Grade Comparison
Immigrants from Greece
English
96.3%
7TH GRADE
85.9/ 100
METRIC RATING
144th/ 347
METRIC RANK
97.6%
7TH GRADE
100.0/ 100
METRIC RATING
15th/ 347
METRIC RANK
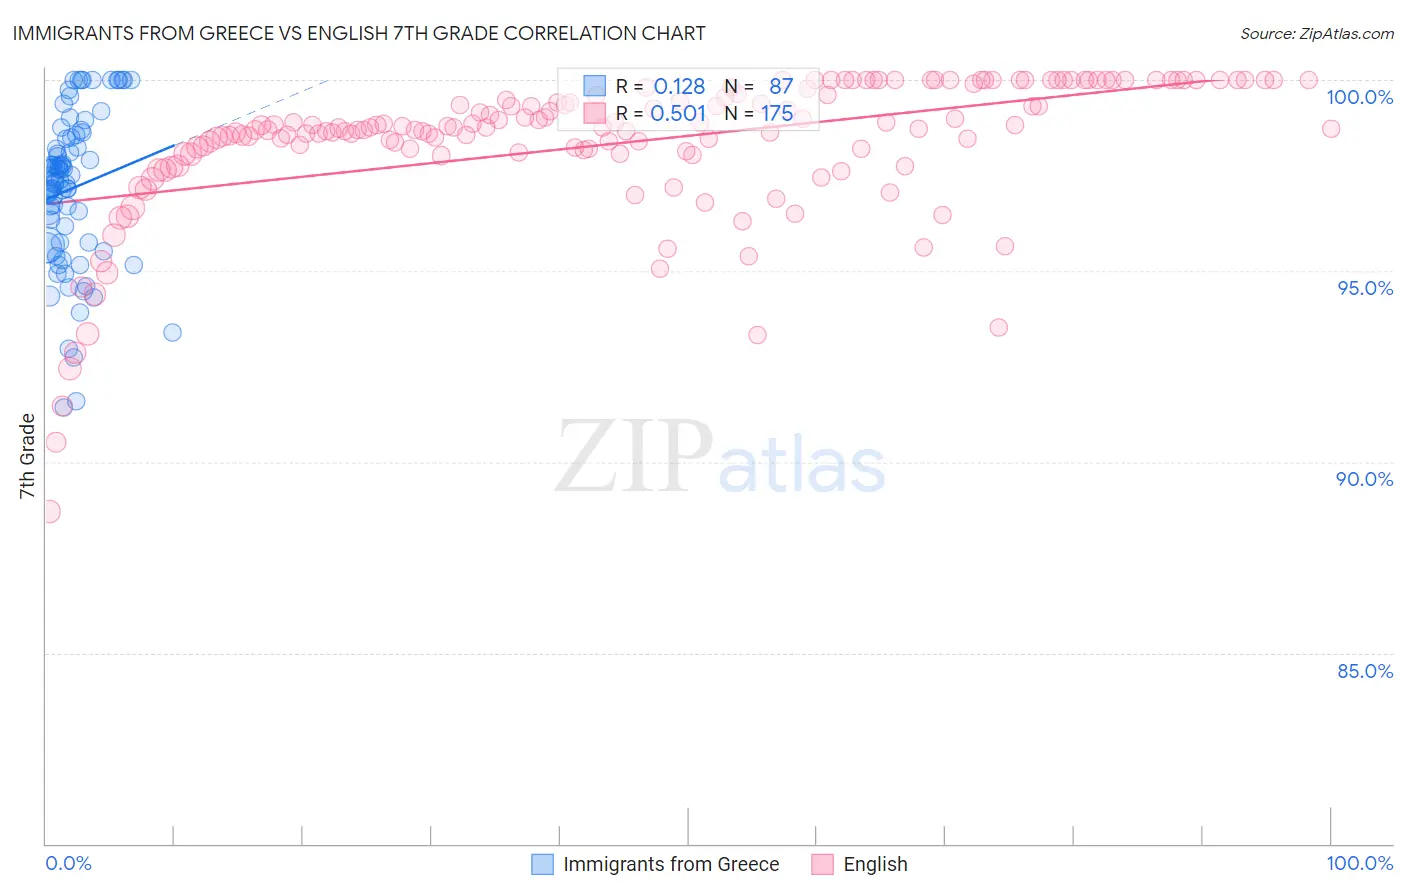
Immigrants from Greece vs English 7th Grade Correlation Chart
The statistical analysis conducted on geographies consisting of 216,879,847 people shows a poor positive correlation between the proportion of Immigrants from Greece and percentage of population with at least 7th grade education in the United States with a correlation coefficient (R) of 0.128 and weighted average of 96.3%. Similarly, the statistical analysis conducted on geographies consisting of 579,981,272 people shows a substantial positive correlation between the proportion of English and percentage of population with at least 7th grade education in the United States with a correlation coefficient (R) of 0.501 and weighted average of 97.6%, a difference of 1.3%.
7th Grade Correlation Summary
| Measurement | Immigrants from Greece | English |
| Minimum | 91.4% | 88.7% |
| Maximum | 100.0% | 100.0% |
| Range | 8.6% | 11.3% |
| Mean | 97.2% | 98.3% |
| Median | 97.4% | 98.7% |
| Interquartile 25% (IQ1) | 95.7% | 98.1% |
| Interquartile 75% (IQ3) | 98.5% | 99.6% |
| Interquartile Range (IQR) | 2.8% | 1.5% |
| Standard Deviation (Sample) | 2.0% | 1.9% |
| Standard Deviation (Population) | 2.0% | 1.9% |
Similar Demographics by 7th Grade
Demographics Similar to Immigrants from Greece by 7th Grade
In terms of 7th grade, the demographic groups most similar to Immigrants from Greece are Spanish (96.3%, a difference of 0.010%), Immigrants from South Central Asia (96.3%, a difference of 0.020%), Burmese (96.3%, a difference of 0.020%), Blackfeet (96.3%, a difference of 0.020%), and Cambodian (96.3%, a difference of 0.030%).
| Demographics | Rating | Rank | 7th Grade |
| Immigrants | Turkey | 90.2 /100 | #137 | Exceptional 96.4% |
| Jordanians | 90.0 /100 | #138 | Excellent 96.4% |
| Basques | 89.3 /100 | #139 | Excellent 96.4% |
| Cambodians | 88.3 /100 | #140 | Excellent 96.3% |
| Immigrants | South Central Asia | 87.1 /100 | #141 | Excellent 96.3% |
| Burmese | 87.1 /100 | #142 | Excellent 96.3% |
| Spanish | 86.6 /100 | #143 | Excellent 96.3% |
| Immigrants | Greece | 85.9 /100 | #144 | Excellent 96.3% |
| Blackfeet | 83.9 /100 | #145 | Excellent 96.3% |
| Immigrants | Eastern Europe | 83.7 /100 | #146 | Excellent 96.3% |
| French American Indians | 83.1 /100 | #147 | Excellent 96.3% |
| Israelis | 82.8 /100 | #148 | Excellent 96.3% |
| Albanians | 82.6 /100 | #149 | Excellent 96.3% |
| Immigrants | Belarus | 82.4 /100 | #150 | Excellent 96.3% |
| Hopi | 81.6 /100 | #151 | Excellent 96.3% |
Demographics Similar to English by 7th Grade
In terms of 7th grade, the demographic groups most similar to English are Pennsylvania German (97.6%, a difference of 0.010%), Swedish (97.6%, a difference of 0.020%), Alaskan Athabascan (97.6%, a difference of 0.060%), Polish (97.6%, a difference of 0.060%), and Irish (97.5%, a difference of 0.060%).
| Demographics | Rating | Rank | 7th Grade |
| Slovaks | 100.0 /100 | #8 | Exceptional 97.8% |
| Germans | 100.0 /100 | #9 | Exceptional 97.7% |
| Slovenes | 100.0 /100 | #10 | Exceptional 97.6% |
| Alaskan Athabascans | 100.0 /100 | #11 | Exceptional 97.6% |
| Poles | 100.0 /100 | #12 | Exceptional 97.6% |
| Swedes | 100.0 /100 | #13 | Exceptional 97.6% |
| Pennsylvania Germans | 100.0 /100 | #14 | Exceptional 97.6% |
| English | 100.0 /100 | #15 | Exceptional 97.6% |
| Irish | 100.0 /100 | #16 | Exceptional 97.5% |
| Scottish | 100.0 /100 | #17 | Exceptional 97.5% |
| Tlingit-Haida | 100.0 /100 | #18 | Exceptional 97.5% |
| Lithuanians | 100.0 /100 | #19 | Exceptional 97.5% |
| Yup'ik | 100.0 /100 | #20 | Exceptional 97.4% |
| Inupiat | 100.0 /100 | #21 | Exceptional 97.4% |
| French Canadians | 100.0 /100 | #22 | Exceptional 97.4% |