Immigrants from Germany vs Aleut Single Male Poverty
COMPARE
Immigrants from Germany
Aleut
Single Male Poverty
Single Male Poverty Comparison
Immigrants from Germany
Aleuts
13.4%
SINGLE MALE POVERTY
2.1/ 100
METRIC RATING
241st/ 347
METRIC RANK
15.4%
SINGLE MALE POVERTY
0.0/ 100
METRIC RATING
303rd/ 347
METRIC RANK
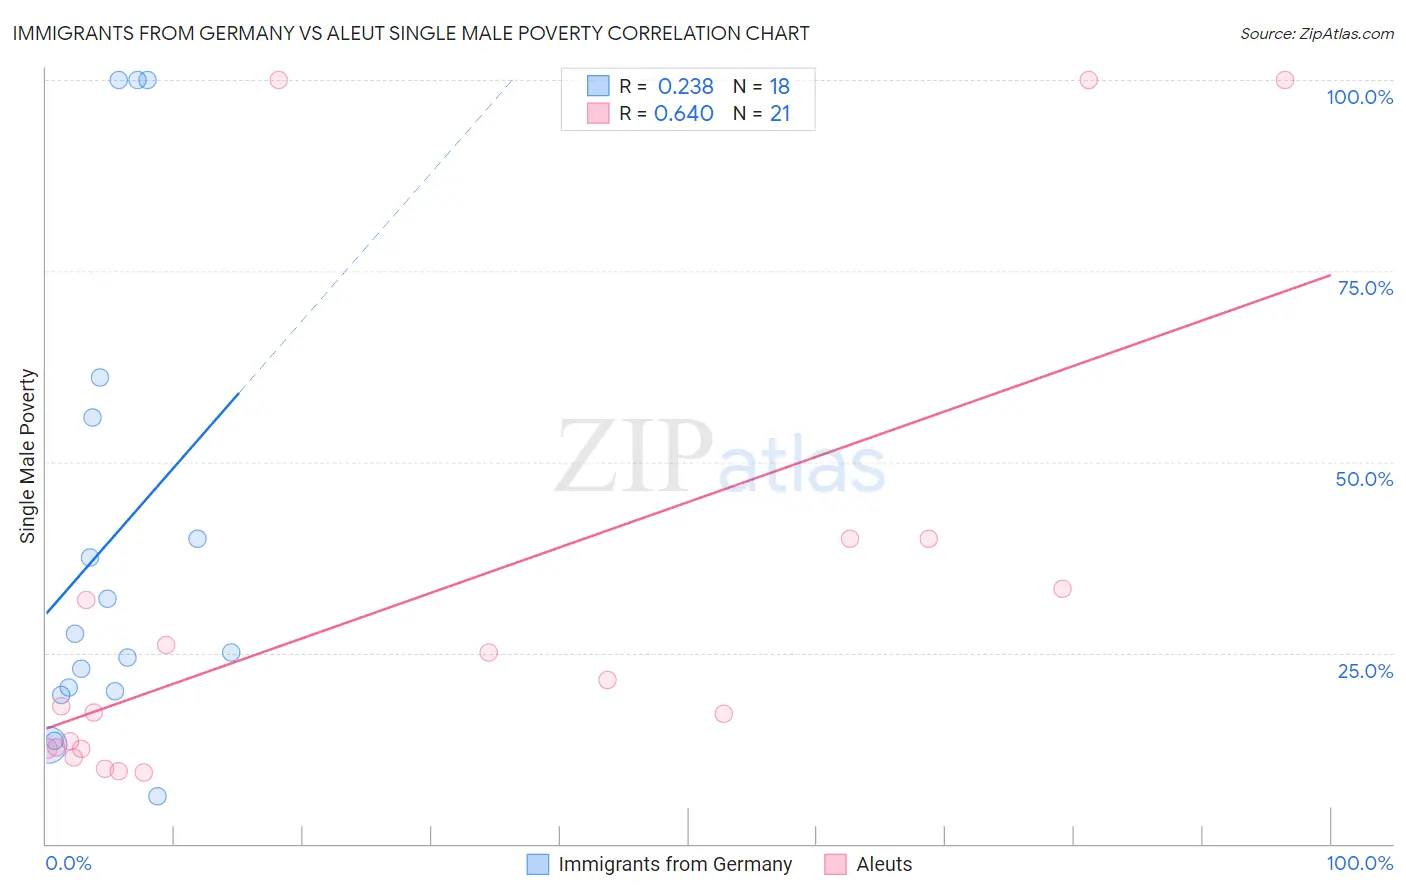
Immigrants from Germany vs Aleut Single Male Poverty Correlation Chart
The statistical analysis conducted on geographies consisting of 402,484,283 people shows a weak positive correlation between the proportion of Immigrants from Germany and poverty level among single males in the United States with a correlation coefficient (R) of 0.238 and weighted average of 13.4%. Similarly, the statistical analysis conducted on geographies consisting of 59,537,447 people shows a significant positive correlation between the proportion of Aleuts and poverty level among single males in the United States with a correlation coefficient (R) of 0.640 and weighted average of 15.4%, a difference of 14.6%.
Single Male Poverty Correlation Summary
| Measurement | Immigrants from Germany | Aleut |
| Minimum | 6.2% | 9.3% |
| Maximum | 100.0% | 100.0% |
| Range | 93.8% | 90.7% |
| Mean | 39.9% | 31.5% |
| Median | 26.2% | 18.0% |
| Interquartile 25% (IQ1) | 19.9% | 12.5% |
| Interquartile 75% (IQ3) | 55.8% | 36.7% |
| Interquartile Range (IQR) | 35.9% | 24.2% |
| Standard Deviation (Sample) | 30.9% | 30.2% |
| Standard Deviation (Population) | 30.1% | 29.5% |
Similar Demographics by Single Male Poverty
Demographics Similar to Immigrants from Germany by Single Male Poverty
In terms of single male poverty, the demographic groups most similar to Immigrants from Germany are Carpatho Rusyn (13.4%, a difference of 0.010%), Barbadian (13.4%, a difference of 0.060%), Belizean (13.4%, a difference of 0.11%), Immigrants from Senegal (13.5%, a difference of 0.33%), and Czechoslovakian (13.4%, a difference of 0.42%).
| Demographics | Rating | Rank | Single Male Poverty |
| Canadians | 4.0 /100 | #234 | Tragic 13.3% |
| Bangladeshis | 3.7 /100 | #235 | Tragic 13.3% |
| Luxembourgers | 3.6 /100 | #236 | Tragic 13.4% |
| British West Indians | 3.4 /100 | #237 | Tragic 13.4% |
| Immigrants | Ghana | 3.2 /100 | #238 | Tragic 13.4% |
| Czechoslovakians | 3.0 /100 | #239 | Tragic 13.4% |
| Belizeans | 2.3 /100 | #240 | Tragic 13.4% |
| Immigrants | Germany | 2.1 /100 | #241 | Tragic 13.4% |
| Carpatho Rusyns | 2.1 /100 | #242 | Tragic 13.4% |
| Barbadians | 2.1 /100 | #243 | Tragic 13.4% |
| Immigrants | Senegal | 1.7 /100 | #244 | Tragic 13.5% |
| Immigrants | Latin America | 1.3 /100 | #245 | Tragic 13.5% |
| Immigrants | Micronesia | 1.2 /100 | #246 | Tragic 13.5% |
| Belgians | 1.2 /100 | #247 | Tragic 13.5% |
| Czechs | 1.2 /100 | #248 | Tragic 13.5% |
Demographics Similar to Aleuts by Single Male Poverty
In terms of single male poverty, the demographic groups most similar to Aleuts are Alaska Native (15.4%, a difference of 0.11%), Blackfeet (15.5%, a difference of 0.64%), Alsatian (15.2%, a difference of 1.0%), Pennsylvania German (15.6%, a difference of 1.1%), and Dominican (15.2%, a difference of 1.2%).
| Demographics | Rating | Rank | Single Male Poverty |
| Africans | 0.0 /100 | #296 | Tragic 14.7% |
| Immigrants | Dominican Republic | 0.0 /100 | #297 | Tragic 14.8% |
| French American Indians | 0.0 /100 | #298 | Tragic 15.0% |
| Delaware | 0.0 /100 | #299 | Tragic 15.0% |
| Cree | 0.0 /100 | #300 | Tragic 15.1% |
| Dominicans | 0.0 /100 | #301 | Tragic 15.2% |
| Alsatians | 0.0 /100 | #302 | Tragic 15.2% |
| Aleuts | 0.0 /100 | #303 | Tragic 15.4% |
| Alaska Natives | 0.0 /100 | #304 | Tragic 15.4% |
| Blackfeet | 0.0 /100 | #305 | Tragic 15.5% |
| Pennsylvania Germans | 0.0 /100 | #306 | Tragic 15.6% |
| Ute | 0.0 /100 | #307 | Tragic 15.7% |
| Potawatomi | 0.0 /100 | #308 | Tragic 15.8% |
| Americans | 0.0 /100 | #309 | Tragic 15.8% |
| Yakama | 0.0 /100 | #310 | Tragic 15.9% |