Immigrants from Germany vs Aleut Master's Degree
COMPARE
Immigrants from Germany
Aleut
Master's Degree
Master's Degree Comparison
Immigrants from Germany
Aleuts
15.8%
MASTER'S DEGREE
85.9/ 100
METRIC RATING
139th/ 347
METRIC RANK
11.8%
MASTER'S DEGREE
0.1/ 100
METRIC RATING
286th/ 347
METRIC RANK
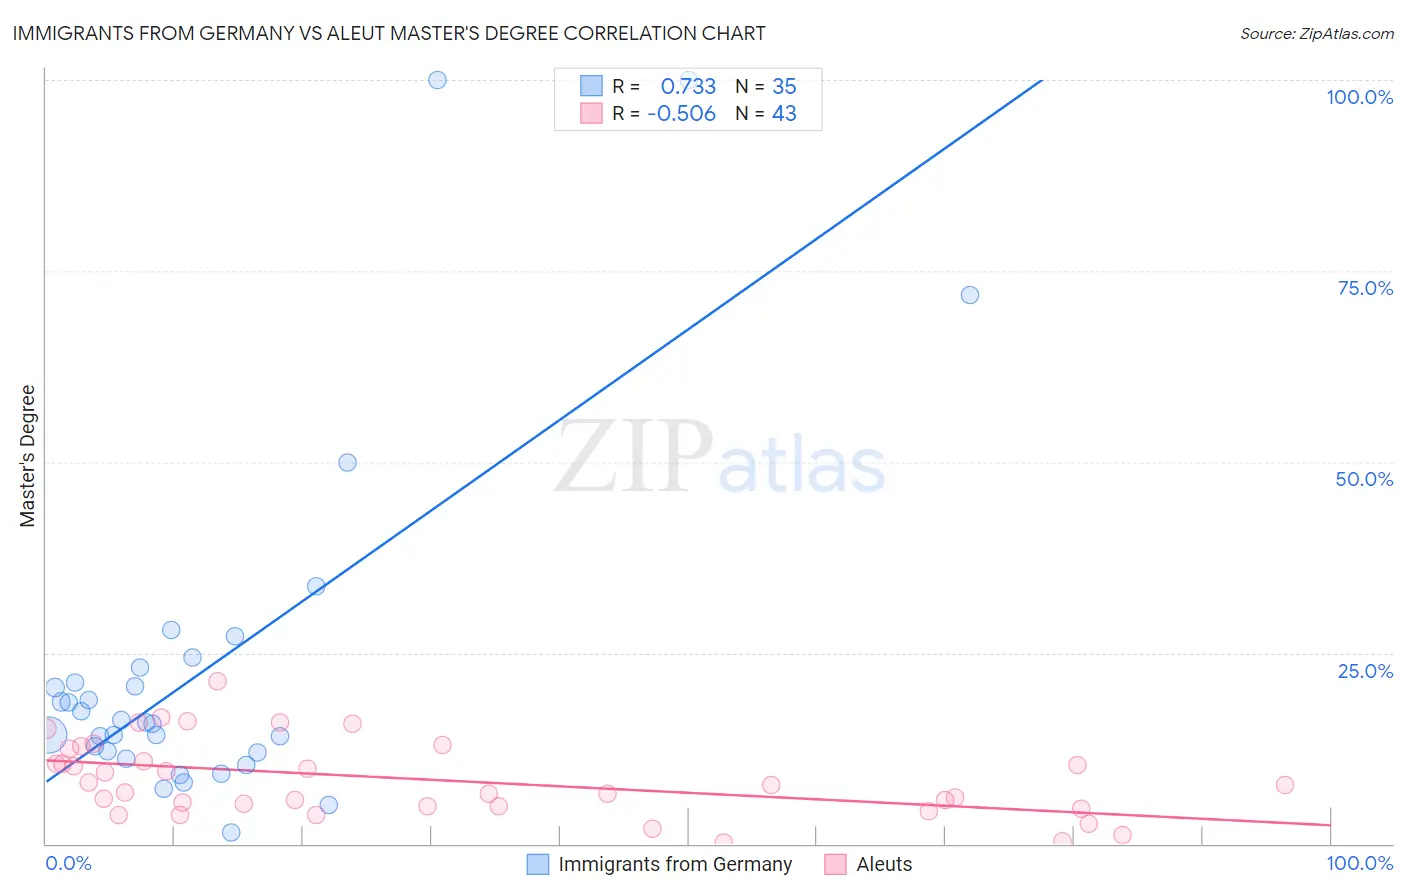
Immigrants from Germany vs Aleut Master's Degree Correlation Chart
The statistical analysis conducted on geographies consisting of 463,768,587 people shows a strong positive correlation between the proportion of Immigrants from Germany and percentage of population with at least master's degree education in the United States with a correlation coefficient (R) of 0.733 and weighted average of 15.8%. Similarly, the statistical analysis conducted on geographies consisting of 61,771,787 people shows a substantial negative correlation between the proportion of Aleuts and percentage of population with at least master's degree education in the United States with a correlation coefficient (R) of -0.506 and weighted average of 11.8%, a difference of 33.8%.
Master's Degree Correlation Summary
| Measurement | Immigrants from Germany | Aleut |
| Minimum | 1.5% | 0.13% |
| Maximum | 100.0% | 21.3% |
| Range | 98.5% | 21.2% |
| Mean | 23.2% | 8.4% |
| Median | 15.9% | 7.7% |
| Interquartile 25% (IQ1) | 11.9% | 4.9% |
| Interquartile 75% (IQ3) | 23.0% | 12.4% |
| Interquartile Range (IQR) | 11.1% | 7.5% |
| Standard Deviation (Sample) | 23.1% | 5.0% |
| Standard Deviation (Population) | 22.7% | 4.9% |
Similar Demographics by Master's Degree
Demographics Similar to Immigrants from Germany by Master's Degree
In terms of master's degree, the demographic groups most similar to Immigrants from Germany are Pakistani (15.8%, a difference of 0.060%), Vietnamese (15.8%, a difference of 0.090%), European (15.8%, a difference of 0.14%), Polish (15.7%, a difference of 0.21%), and Assyrian/Chaldean/Syriac (15.8%, a difference of 0.24%).
| Demographics | Rating | Rank | Master's Degree |
| Serbians | 91.7 /100 | #132 | Exceptional 16.1% |
| Immigrants | Sudan | 90.2 /100 | #133 | Exceptional 16.0% |
| Venezuelans | 88.4 /100 | #134 | Excellent 15.9% |
| South American Indians | 88.4 /100 | #135 | Excellent 15.9% |
| Assyrians/Chaldeans/Syriacs | 86.8 /100 | #136 | Excellent 15.8% |
| Europeans | 86.4 /100 | #137 | Excellent 15.8% |
| Pakistanis | 86.1 /100 | #138 | Excellent 15.8% |
| Immigrants | Germany | 85.9 /100 | #139 | Excellent 15.8% |
| Vietnamese | 85.5 /100 | #140 | Excellent 15.8% |
| Poles | 85.0 /100 | #141 | Excellent 15.7% |
| Immigrants | Africa | 84.0 /100 | #142 | Excellent 15.7% |
| Immigrants | Venezuela | 83.6 /100 | #143 | Excellent 15.7% |
| Canadians | 83.3 /100 | #144 | Excellent 15.7% |
| South Americans | 81.3 /100 | #145 | Excellent 15.6% |
| Immigrants | Afghanistan | 79.4 /100 | #146 | Good 15.6% |
Demographics Similar to Aleuts by Master's Degree
In terms of master's degree, the demographic groups most similar to Aleuts are Immigrants from Haiti (11.8%, a difference of 0.20%), Immigrants from Nicaragua (11.8%, a difference of 0.35%), Immigrants from Honduras (11.8%, a difference of 0.36%), Guatemalan (11.7%, a difference of 0.44%), and Ottawa (11.9%, a difference of 0.54%).
| Demographics | Rating | Rank | Master's Degree |
| Immigrants | Belize | 0.2 /100 | #279 | Tragic 12.1% |
| Immigrants | Dominican Republic | 0.2 /100 | #280 | Tragic 12.1% |
| Malaysians | 0.2 /100 | #281 | Tragic 12.0% |
| Immigrants | El Salvador | 0.2 /100 | #282 | Tragic 12.0% |
| Hondurans | 0.2 /100 | #283 | Tragic 11.9% |
| Ottawa | 0.2 /100 | #284 | Tragic 11.9% |
| Immigrants | Nicaragua | 0.2 /100 | #285 | Tragic 11.8% |
| Aleuts | 0.1 /100 | #286 | Tragic 11.8% |
| Immigrants | Haiti | 0.1 /100 | #287 | Tragic 11.8% |
| Immigrants | Honduras | 0.1 /100 | #288 | Tragic 11.8% |
| Guatemalans | 0.1 /100 | #289 | Tragic 11.7% |
| Ute | 0.1 /100 | #290 | Tragic 11.7% |
| Colville | 0.1 /100 | #291 | Tragic 11.6% |
| Immigrants | Guatemala | 0.1 /100 | #292 | Tragic 11.6% |
| Alaska Natives | 0.1 /100 | #293 | Tragic 11.6% |