Immigrants from Ethiopia vs Brazilian Single Male Poverty
COMPARE
Immigrants from Ethiopia
Brazilian
Single Male Poverty
Single Male Poverty Comparison
Immigrants from Ethiopia
Brazilians
11.4%
SINGLE MALE POVERTY
100.0/ 100
METRIC RATING
34th/ 347
METRIC RANK
11.8%
SINGLE MALE POVERTY
99.8/ 100
METRIC RATING
59th/ 347
METRIC RANK
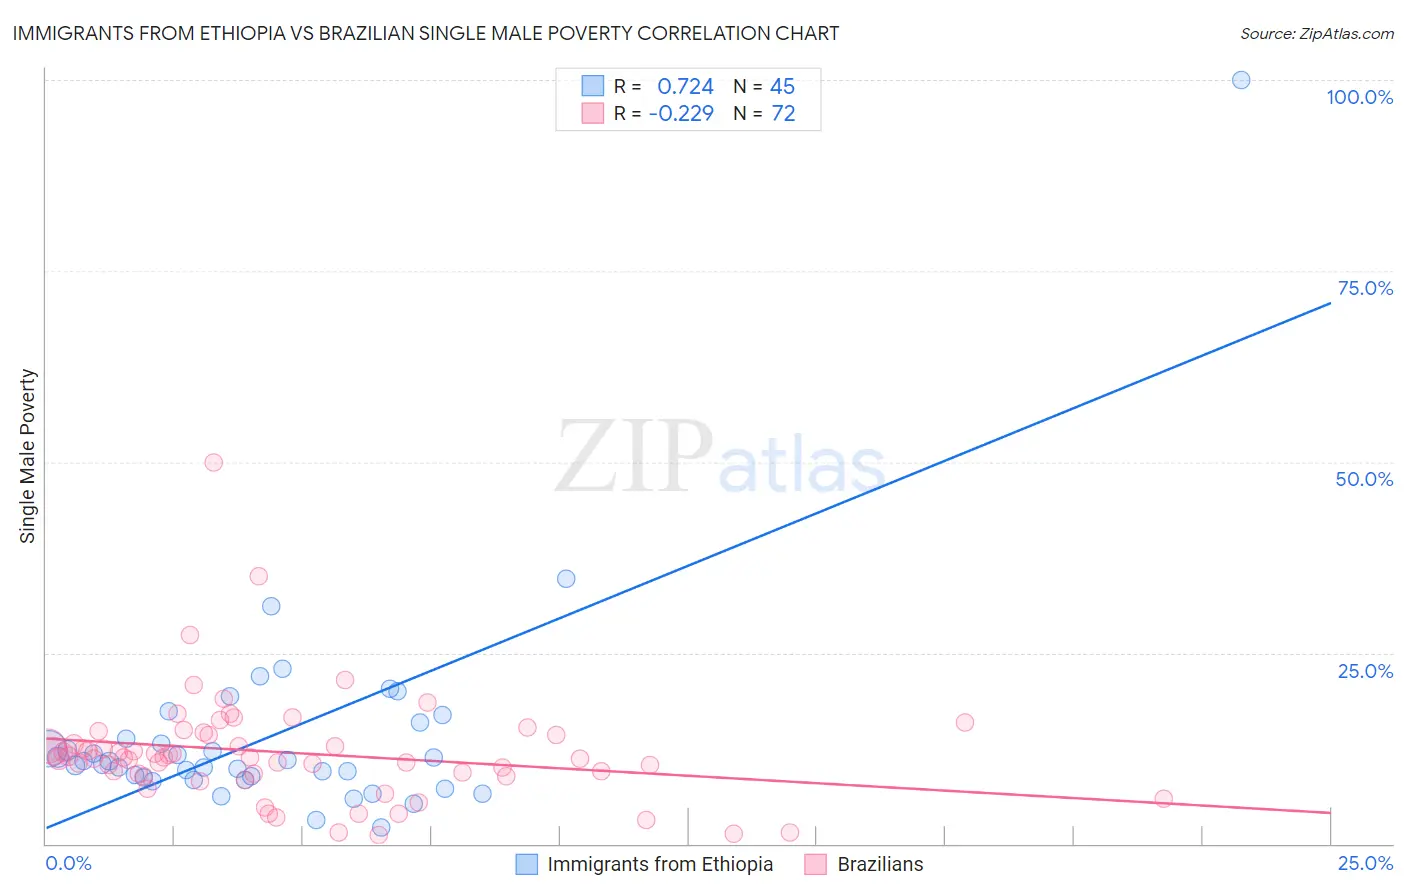
Immigrants from Ethiopia vs Brazilian Single Male Poverty Correlation Chart
The statistical analysis conducted on geographies consisting of 197,139,840 people shows a strong positive correlation between the proportion of Immigrants from Ethiopia and poverty level among single males in the United States with a correlation coefficient (R) of 0.724 and weighted average of 11.4%. Similarly, the statistical analysis conducted on geographies consisting of 290,096,806 people shows a weak negative correlation between the proportion of Brazilians and poverty level among single males in the United States with a correlation coefficient (R) of -0.229 and weighted average of 11.8%, a difference of 2.8%.
Single Male Poverty Correlation Summary
| Measurement | Immigrants from Ethiopia | Brazilian |
| Minimum | 2.2% | 1.1% |
| Maximum | 100.0% | 50.0% |
| Range | 97.8% | 48.9% |
| Mean | 14.1% | 11.9% |
| Median | 10.8% | 11.3% |
| Interquartile 25% (IQ1) | 8.5% | 9.0% |
| Interquartile 75% (IQ3) | 14.8% | 14.3% |
| Interquartile Range (IQR) | 6.3% | 5.3% |
| Standard Deviation (Sample) | 14.6% | 7.3% |
| Standard Deviation (Population) | 14.4% | 7.2% |
Similar Demographics by Single Male Poverty
Demographics Similar to Immigrants from Ethiopia by Single Male Poverty
In terms of single male poverty, the demographic groups most similar to Immigrants from Ethiopia are Immigrants from Vietnam (11.4%, a difference of 0.040%), Immigrants from South Eastern Asia (11.4%, a difference of 0.040%), Immigrants from Serbia (11.4%, a difference of 0.070%), Immigrants from Eastern Asia (11.4%, a difference of 0.11%), and Immigrants from Singapore (11.4%, a difference of 0.12%).
| Demographics | Rating | Rank | Single Male Poverty |
| Immigrants | China | 100.0 /100 | #27 | Exceptional 11.4% |
| Immigrants | Asia | 100.0 /100 | #28 | Exceptional 11.4% |
| Immigrants | Egypt | 100.0 /100 | #29 | Exceptional 11.4% |
| Iranians | 100.0 /100 | #30 | Exceptional 11.4% |
| Immigrants | Iran | 100.0 /100 | #31 | Exceptional 11.4% |
| Immigrants | Eastern Asia | 100.0 /100 | #32 | Exceptional 11.4% |
| Immigrants | Vietnam | 100.0 /100 | #33 | Exceptional 11.4% |
| Immigrants | Ethiopia | 100.0 /100 | #34 | Exceptional 11.4% |
| Immigrants | South Eastern Asia | 100.0 /100 | #35 | Exceptional 11.4% |
| Immigrants | Serbia | 100.0 /100 | #36 | Exceptional 11.4% |
| Immigrants | Singapore | 100.0 /100 | #37 | Exceptional 11.4% |
| Sri Lankans | 100.0 /100 | #38 | Exceptional 11.5% |
| Soviet Union | 100.0 /100 | #39 | Exceptional 11.5% |
| Immigrants | Korea | 100.0 /100 | #40 | Exceptional 11.5% |
| Immigrants | Iraq | 99.9 /100 | #41 | Exceptional 11.5% |
Demographics Similar to Brazilians by Single Male Poverty
In terms of single male poverty, the demographic groups most similar to Brazilians are Immigrants from Brazil (11.7%, a difference of 0.080%), Immigrants from Romania (11.7%, a difference of 0.11%), Peruvian (11.8%, a difference of 0.21%), Cambodian (11.8%, a difference of 0.23%), and Burmese (11.7%, a difference of 0.26%).
| Demographics | Rating | Rank | Single Male Poverty |
| Samoans | 99.9 /100 | #52 | Exceptional 11.7% |
| Bulgarians | 99.9 /100 | #53 | Exceptional 11.7% |
| Immigrants | Uzbekistan | 99.9 /100 | #54 | Exceptional 11.7% |
| Cypriots | 99.9 /100 | #55 | Exceptional 11.7% |
| Burmese | 99.8 /100 | #56 | Exceptional 11.7% |
| Immigrants | Romania | 99.8 /100 | #57 | Exceptional 11.7% |
| Immigrants | Brazil | 99.8 /100 | #58 | Exceptional 11.7% |
| Brazilians | 99.8 /100 | #59 | Exceptional 11.8% |
| Peruvians | 99.8 /100 | #60 | Exceptional 11.8% |
| Cambodians | 99.8 /100 | #61 | Exceptional 11.8% |
| Immigrants | Sri Lanka | 99.7 /100 | #62 | Exceptional 11.8% |
| Immigrants | Belarus | 99.7 /100 | #63 | Exceptional 11.8% |
| Immigrants | Eastern Europe | 99.6 /100 | #64 | Exceptional 11.8% |
| Laotians | 99.6 /100 | #65 | Exceptional 11.9% |
| Immigrants | Uruguay | 99.6 /100 | #66 | Exceptional 11.9% |