Ottawa vs Immigrants from Zaire Poverty
COMPARE
Ottawa
Immigrants from Zaire
Poverty
Poverty Comparison
Ottawa
Immigrants from Zaire
14.3%
POVERTY
0.1/ 100
METRIC RATING
258th/ 347
METRIC RANK
15.1%
POVERTY
0.0/ 100
METRIC RATING
293rd/ 347
METRIC RANK
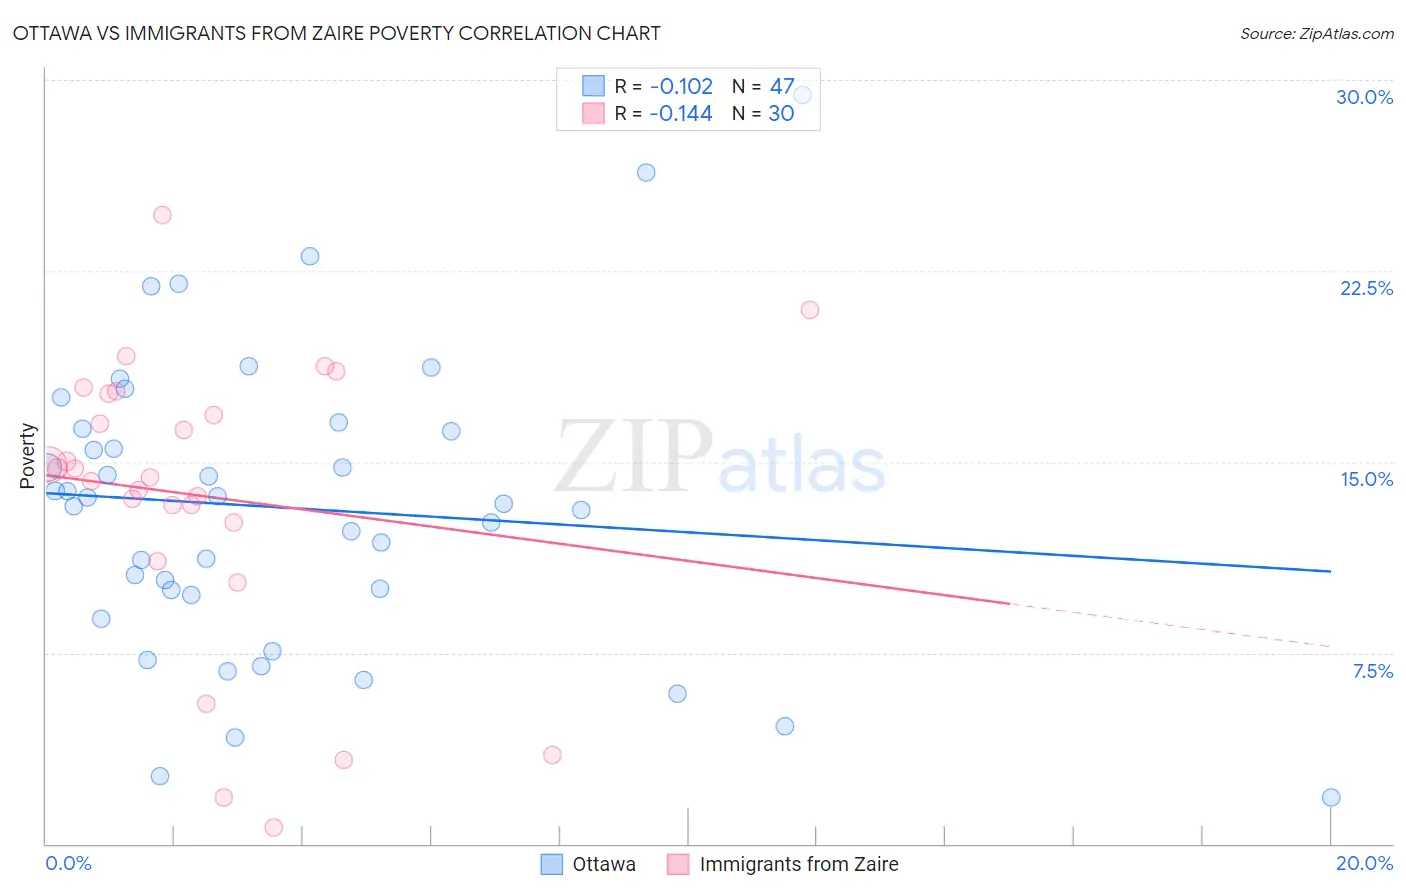
Ottawa vs Immigrants from Zaire Poverty Correlation Chart
The statistical analysis conducted on geographies consisting of 49,944,420 people shows a poor negative correlation between the proportion of Ottawa and poverty level in the United States with a correlation coefficient (R) of -0.102 and weighted average of 14.3%. Similarly, the statistical analysis conducted on geographies consisting of 107,241,785 people shows a poor negative correlation between the proportion of Immigrants from Zaire and poverty level in the United States with a correlation coefficient (R) of -0.144 and weighted average of 15.1%, a difference of 5.8%.
Poverty Correlation Summary
| Measurement | Ottawa | Immigrants from Zaire |
| Minimum | 1.8% | 0.62% |
| Maximum | 29.4% | 24.7% |
| Range | 27.6% | 24.1% |
| Mean | 13.2% | 13.7% |
| Median | 13.4% | 14.6% |
| Interquartile 25% (IQ1) | 9.8% | 12.6% |
| Interquartile 75% (IQ3) | 16.3% | 17.7% |
| Interquartile Range (IQR) | 6.5% | 5.1% |
| Standard Deviation (Sample) | 5.9% | 5.7% |
| Standard Deviation (Population) | 5.8% | 5.6% |
Similar Demographics by Poverty
Demographics Similar to Ottawa by Poverty
In terms of poverty, the demographic groups most similar to Ottawa are Trinidadian and Tobagonian (14.3%, a difference of 0.010%), Mexican American Indian (14.3%, a difference of 0.050%), Immigrants from Ecuador (14.3%, a difference of 0.070%), Immigrants from El Salvador (14.3%, a difference of 0.17%), and Immigrants from Nicaragua (14.3%, a difference of 0.27%).
| Demographics | Rating | Rank | Poverty |
| Immigrants | Burma/Myanmar | 0.2 /100 | #251 | Tragic 14.2% |
| Spanish American Indians | 0.2 /100 | #252 | Tragic 14.2% |
| Immigrants | Trinidad and Tobago | 0.2 /100 | #253 | Tragic 14.2% |
| Immigrants | El Salvador | 0.1 /100 | #254 | Tragic 14.3% |
| Immigrants | Ecuador | 0.1 /100 | #255 | Tragic 14.3% |
| Mexican American Indians | 0.1 /100 | #256 | Tragic 14.3% |
| Trinidadians and Tobagonians | 0.1 /100 | #257 | Tragic 14.3% |
| Ottawa | 0.1 /100 | #258 | Tragic 14.3% |
| Immigrants | Nicaragua | 0.1 /100 | #259 | Tragic 14.3% |
| Cape Verdeans | 0.1 /100 | #260 | Tragic 14.4% |
| Cherokee | 0.1 /100 | #261 | Tragic 14.4% |
| Immigrants | Liberia | 0.1 /100 | #262 | Tragic 14.4% |
| Jamaicans | 0.1 /100 | #263 | Tragic 14.4% |
| Immigrants | Jamaica | 0.1 /100 | #264 | Tragic 14.4% |
| Immigrants | Guyana | 0.1 /100 | #265 | Tragic 14.5% |
Demographics Similar to Immigrants from Zaire by Poverty
In terms of poverty, the demographic groups most similar to Immigrants from Zaire are Indonesian (15.1%, a difference of 0.010%), Immigrants from Cabo Verde (15.1%, a difference of 0.060%), Mexican (15.1%, a difference of 0.18%), Immigrants from Belize (15.1%, a difference of 0.29%), and Yaqui (15.1%, a difference of 0.40%).
| Demographics | Rating | Rank | Poverty |
| Immigrants | Latin America | 0.0 /100 | #286 | Tragic 15.0% |
| Inupiat | 0.0 /100 | #287 | Tragic 15.1% |
| Yaqui | 0.0 /100 | #288 | Tragic 15.1% |
| Immigrants | Belize | 0.0 /100 | #289 | Tragic 15.1% |
| Mexicans | 0.0 /100 | #290 | Tragic 15.1% |
| Immigrants | Cabo Verde | 0.0 /100 | #291 | Tragic 15.1% |
| Indonesians | 0.0 /100 | #292 | Tragic 15.1% |
| Immigrants | Zaire | 0.0 /100 | #293 | Tragic 15.1% |
| Blackfeet | 0.0 /100 | #294 | Tragic 15.2% |
| Guatemalans | 0.0 /100 | #295 | Tragic 15.3% |
| Hispanics or Latinos | 0.0 /100 | #296 | Tragic 15.3% |
| Immigrants | Bangladesh | 0.0 /100 | #297 | Tragic 15.3% |
| Immigrants | Senegal | 0.0 /100 | #298 | Tragic 15.3% |
| Senegalese | 0.0 /100 | #299 | Tragic 15.3% |
| Immigrants | Central America | 0.0 /100 | #300 | Tragic 15.4% |