Immigrants from Eritrea vs Barbadian Female Poverty Among 25-34 Year Olds
COMPARE
Immigrants from Eritrea
Barbadian
Female Poverty Among 25-34 Year Olds
Female Poverty Among 25-34 Year Olds Comparison
Immigrants from Eritrea
Barbadians
13.7%
FEMALE POVERTY AMONG 25-34 YEAR OLDS
32.7/ 100
METRIC RATING
188th/ 347
METRIC RANK
14.8%
FEMALE POVERTY AMONG 25-34 YEAR OLDS
1.2/ 100
METRIC RATING
242nd/ 347
METRIC RANK
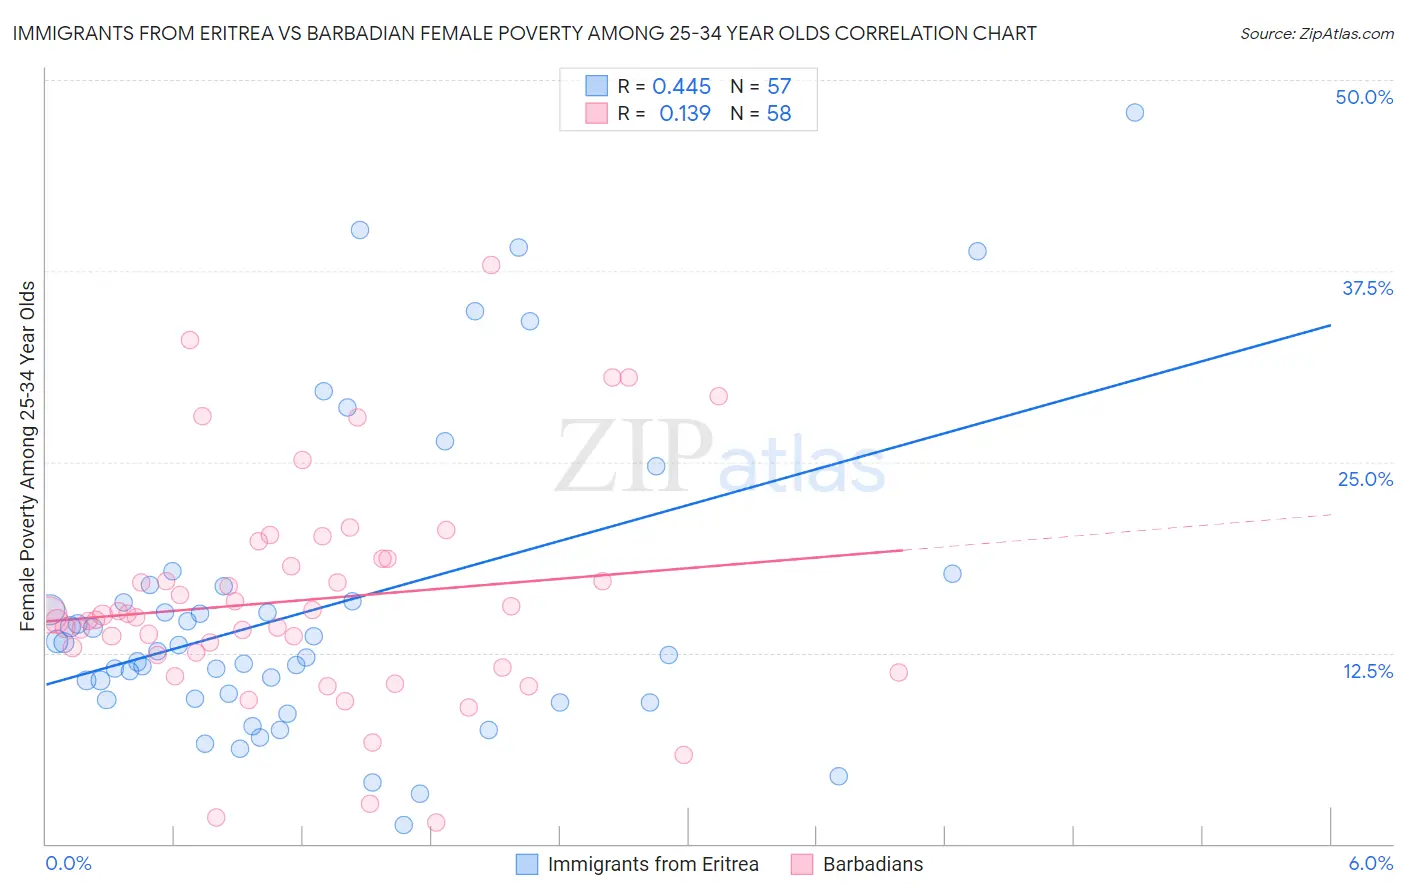
Immigrants from Eritrea vs Barbadian Female Poverty Among 25-34 Year Olds Correlation Chart
The statistical analysis conducted on geographies consisting of 104,678,309 people shows a moderate positive correlation between the proportion of Immigrants from Eritrea and poverty level among females between the ages 25 and 34 in the United States with a correlation coefficient (R) of 0.445 and weighted average of 13.7%. Similarly, the statistical analysis conducted on geographies consisting of 140,596,160 people shows a poor positive correlation between the proportion of Barbadians and poverty level among females between the ages 25 and 34 in the United States with a correlation coefficient (R) of 0.139 and weighted average of 14.8%, a difference of 7.6%.
Female Poverty Among 25-34 Year Olds Correlation Summary
| Measurement | Immigrants from Eritrea | Barbadian |
| Minimum | 1.2% | 1.4% |
| Maximum | 47.9% | 37.9% |
| Range | 46.6% | 36.5% |
| Mean | 15.4% | 16.0% |
| Median | 12.6% | 14.9% |
| Interquartile 25% (IQ1) | 9.5% | 12.3% |
| Interquartile 75% (IQ3) | 16.4% | 18.7% |
| Interquartile Range (IQR) | 6.9% | 6.4% |
| Standard Deviation (Sample) | 10.0% | 7.3% |
| Standard Deviation (Population) | 9.9% | 7.2% |
Similar Demographics by Female Poverty Among 25-34 Year Olds
Demographics Similar to Immigrants from Eritrea by Female Poverty Among 25-34 Year Olds
In terms of female poverty among 25-34 year olds, the demographic groups most similar to Immigrants from Eritrea are Finnish (13.7%, a difference of 0.020%), Immigrants from Uruguay (13.7%, a difference of 0.13%), Slovak (13.7%, a difference of 0.13%), Irish (13.7%, a difference of 0.24%), and Dutch (13.8%, a difference of 0.28%).
| Demographics | Rating | Rank | Female Poverty Among 25-34 Year Olds |
| Guamanians/Chamorros | 41.5 /100 | #181 | Average 13.6% |
| Immigrants | Venezuela | 40.7 /100 | #182 | Average 13.6% |
| Portuguese | 40.3 /100 | #183 | Average 13.6% |
| Czechoslovakians | 36.8 /100 | #184 | Fair 13.7% |
| Irish | 35.3 /100 | #185 | Fair 13.7% |
| Immigrants | Uruguay | 34.1 /100 | #186 | Fair 13.7% |
| Slovaks | 34.1 /100 | #187 | Fair 13.7% |
| Immigrants | Eritrea | 32.7 /100 | #188 | Fair 13.7% |
| Finns | 32.5 /100 | #189 | Fair 13.7% |
| Dutch | 29.7 /100 | #190 | Fair 13.8% |
| Immigrants | St. Vincent and the Grenadines | 29.3 /100 | #191 | Fair 13.8% |
| Tlingit-Haida | 28.1 /100 | #192 | Fair 13.8% |
| Immigrants | Kenya | 28.0 /100 | #193 | Fair 13.8% |
| Moroccans | 25.1 /100 | #194 | Fair 13.8% |
| Immigrants | Cambodia | 24.0 /100 | #195 | Fair 13.9% |
Demographics Similar to Barbadians by Female Poverty Among 25-34 Year Olds
In terms of female poverty among 25-34 year olds, the demographic groups most similar to Barbadians are Scotch-Irish (14.8%, a difference of 0.0%), Immigrants from Nicaragua (14.8%, a difference of 0.040%), Immigrants from Bangladesh (14.8%, a difference of 0.040%), Immigrants from Middle Africa (14.8%, a difference of 0.22%), and Immigrants from Grenada (14.7%, a difference of 0.26%).
| Demographics | Rating | Rank | Female Poverty Among 25-34 Year Olds |
| Immigrants | Jamaica | 1.4 /100 | #235 | Tragic 14.7% |
| Salvadorans | 1.4 /100 | #236 | Tragic 14.7% |
| Immigrants | Ghana | 1.4 /100 | #237 | Tragic 14.7% |
| Alsatians | 1.4 /100 | #238 | Tragic 14.7% |
| Malaysians | 1.4 /100 | #239 | Tragic 14.7% |
| Immigrants | Grenada | 1.3 /100 | #240 | Tragic 14.7% |
| Scotch-Irish | 1.2 /100 | #241 | Tragic 14.8% |
| Barbadians | 1.2 /100 | #242 | Tragic 14.8% |
| Immigrants | Nicaragua | 1.1 /100 | #243 | Tragic 14.8% |
| Immigrants | Bangladesh | 1.1 /100 | #244 | Tragic 14.8% |
| Immigrants | Middle Africa | 1.0 /100 | #245 | Tragic 14.8% |
| Jamaicans | 1.0 /100 | #246 | Tragic 14.8% |
| German Russians | 0.8 /100 | #247 | Tragic 14.9% |
| Immigrants | Western Africa | 0.8 /100 | #248 | Tragic 14.9% |
| Immigrants | Haiti | 0.5 /100 | #249 | Tragic 15.0% |