Immigrants from Eritrea vs Greek Female Poverty Among 25-34 Year Olds
COMPARE
Immigrants from Eritrea
Greek
Female Poverty Among 25-34 Year Olds
Female Poverty Among 25-34 Year Olds Comparison
Immigrants from Eritrea
Greeks
13.7%
FEMALE POVERTY AMONG 25-34 YEAR OLDS
32.7/ 100
METRIC RATING
188th/ 347
METRIC RANK
12.3%
FEMALE POVERTY AMONG 25-34 YEAR OLDS
98.9/ 100
METRIC RATING
76th/ 347
METRIC RANK
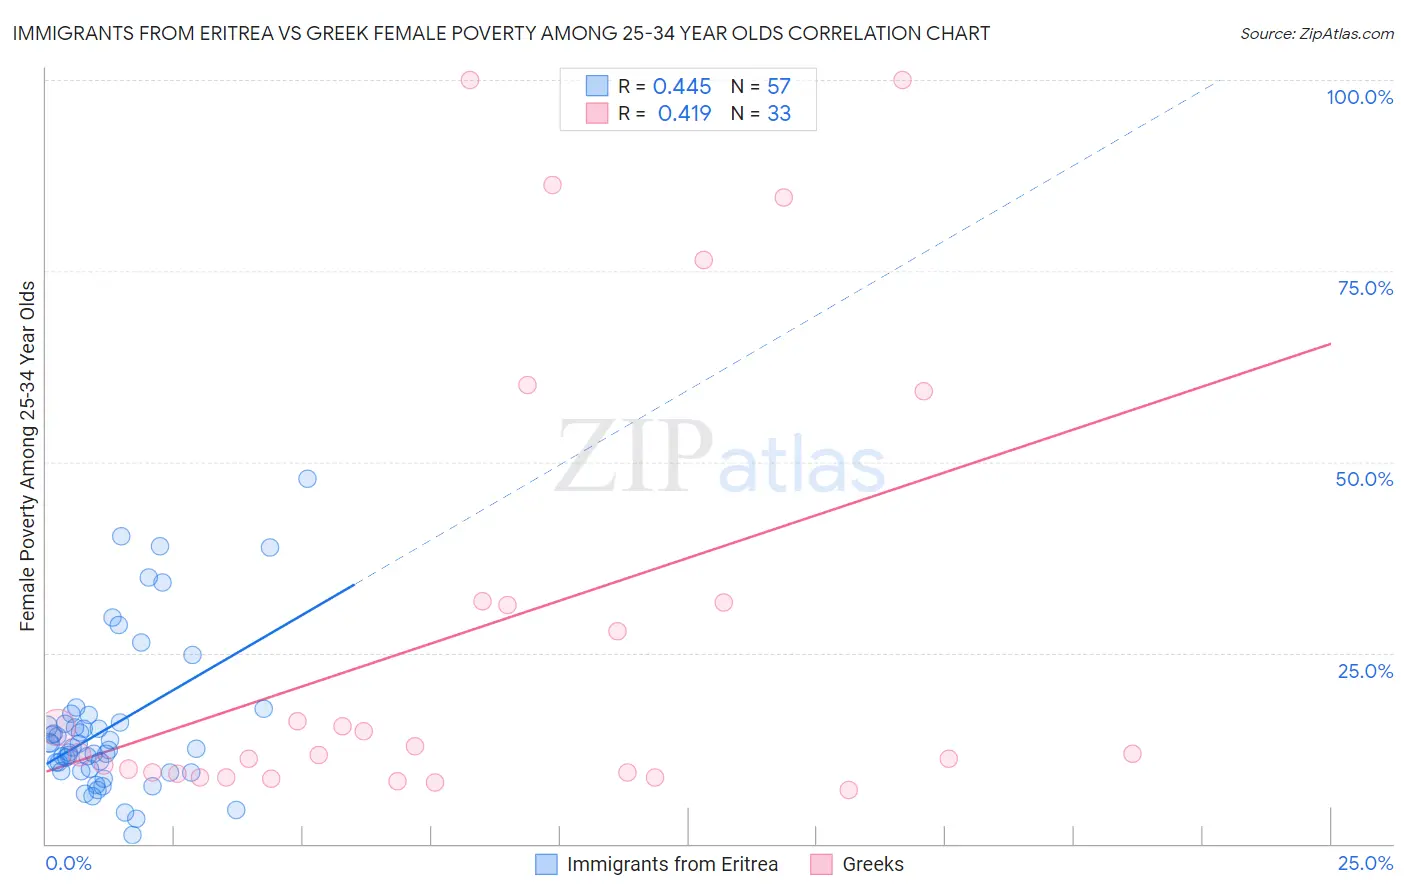
Immigrants from Eritrea vs Greek Female Poverty Among 25-34 Year Olds Correlation Chart
The statistical analysis conducted on geographies consisting of 104,678,309 people shows a moderate positive correlation between the proportion of Immigrants from Eritrea and poverty level among females between the ages 25 and 34 in the United States with a correlation coefficient (R) of 0.445 and weighted average of 13.7%. Similarly, the statistical analysis conducted on geographies consisting of 470,128,205 people shows a moderate positive correlation between the proportion of Greeks and poverty level among females between the ages 25 and 34 in the United States with a correlation coefficient (R) of 0.419 and weighted average of 12.3%, a difference of 11.8%.
Female Poverty Among 25-34 Year Olds Correlation Summary
| Measurement | Immigrants from Eritrea | Greek |
| Minimum | 1.2% | 7.0% |
| Maximum | 47.9% | 100.0% |
| Range | 46.6% | 93.0% |
| Mean | 15.4% | 28.1% |
| Median | 12.6% | 11.8% |
| Interquartile 25% (IQ1) | 9.5% | 9.2% |
| Interquartile 75% (IQ3) | 16.4% | 31.6% |
| Interquartile Range (IQR) | 6.9% | 22.4% |
| Standard Deviation (Sample) | 10.0% | 29.6% |
| Standard Deviation (Population) | 9.9% | 29.1% |
Similar Demographics by Female Poverty Among 25-34 Year Olds
Demographics Similar to Immigrants from Eritrea by Female Poverty Among 25-34 Year Olds
In terms of female poverty among 25-34 year olds, the demographic groups most similar to Immigrants from Eritrea are Finnish (13.7%, a difference of 0.020%), Immigrants from Uruguay (13.7%, a difference of 0.13%), Slovak (13.7%, a difference of 0.13%), Irish (13.7%, a difference of 0.24%), and Dutch (13.8%, a difference of 0.28%).
| Demographics | Rating | Rank | Female Poverty Among 25-34 Year Olds |
| Guamanians/Chamorros | 41.5 /100 | #181 | Average 13.6% |
| Immigrants | Venezuela | 40.7 /100 | #182 | Average 13.6% |
| Portuguese | 40.3 /100 | #183 | Average 13.6% |
| Czechoslovakians | 36.8 /100 | #184 | Fair 13.7% |
| Irish | 35.3 /100 | #185 | Fair 13.7% |
| Immigrants | Uruguay | 34.1 /100 | #186 | Fair 13.7% |
| Slovaks | 34.1 /100 | #187 | Fair 13.7% |
| Immigrants | Eritrea | 32.7 /100 | #188 | Fair 13.7% |
| Finns | 32.5 /100 | #189 | Fair 13.7% |
| Dutch | 29.7 /100 | #190 | Fair 13.8% |
| Immigrants | St. Vincent and the Grenadines | 29.3 /100 | #191 | Fair 13.8% |
| Tlingit-Haida | 28.1 /100 | #192 | Fair 13.8% |
| Immigrants | Kenya | 28.0 /100 | #193 | Fair 13.8% |
| Moroccans | 25.1 /100 | #194 | Fair 13.8% |
| Immigrants | Cambodia | 24.0 /100 | #195 | Fair 13.9% |
Demographics Similar to Greeks by Female Poverty Among 25-34 Year Olds
In terms of female poverty among 25-34 year olds, the demographic groups most similar to Greeks are Estonian (12.3%, a difference of 0.060%), Immigrants from Sweden (12.3%, a difference of 0.11%), Immigrants from Vietnam (12.3%, a difference of 0.14%), Immigrants from Italy (12.3%, a difference of 0.16%), and Immigrants from Ukraine (12.3%, a difference of 0.39%).
| Demographics | Rating | Rank | Female Poverty Among 25-34 Year Olds |
| Immigrants | Lebanon | 99.1 /100 | #69 | Exceptional 12.2% |
| Immigrants | Belgium | 99.1 /100 | #70 | Exceptional 12.2% |
| Immigrants | Scotland | 99.1 /100 | #71 | Exceptional 12.2% |
| Lithuanians | 99.1 /100 | #72 | Exceptional 12.2% |
| Immigrants | Vietnam | 98.9 /100 | #73 | Exceptional 12.3% |
| Immigrants | Sweden | 98.9 /100 | #74 | Exceptional 12.3% |
| Estonians | 98.9 /100 | #75 | Exceptional 12.3% |
| Greeks | 98.9 /100 | #76 | Exceptional 12.3% |
| Immigrants | Italy | 98.8 /100 | #77 | Exceptional 12.3% |
| Immigrants | Ukraine | 98.6 /100 | #78 | Exceptional 12.3% |
| Immigrants | Jordan | 98.5 /100 | #79 | Exceptional 12.4% |
| Immigrants | Malaysia | 98.3 /100 | #80 | Exceptional 12.4% |
| Immigrants | Kazakhstan | 98.1 /100 | #81 | Exceptional 12.4% |
| Ethiopians | 98.0 /100 | #82 | Exceptional 12.4% |
| Albanians | 97.7 /100 | #83 | Exceptional 12.5% |