Immigrants from Africa vs Greek Female Poverty Among 25-34 Year Olds
COMPARE
Immigrants from Africa
Greek
Female Poverty Among 25-34 Year Olds
Female Poverty Among 25-34 Year Olds Comparison
Immigrants from Africa
Greeks
14.1%
FEMALE POVERTY AMONG 25-34 YEAR OLDS
13.4/ 100
METRIC RATING
205th/ 347
METRIC RANK
12.3%
FEMALE POVERTY AMONG 25-34 YEAR OLDS
98.9/ 100
METRIC RATING
76th/ 347
METRIC RANK
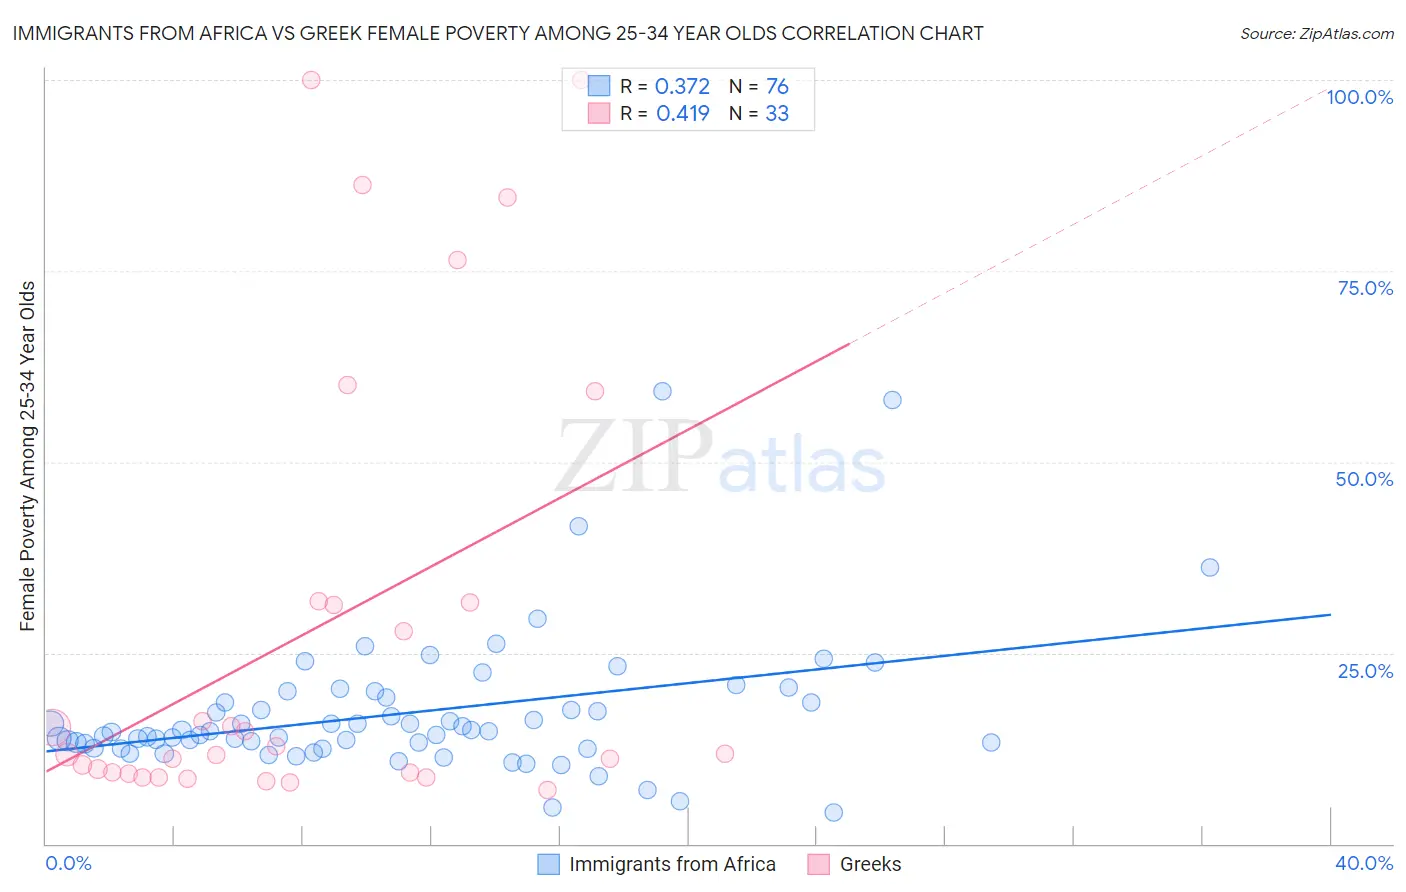
Immigrants from Africa vs Greek Female Poverty Among 25-34 Year Olds Correlation Chart
The statistical analysis conducted on geographies consisting of 459,678,393 people shows a mild positive correlation between the proportion of Immigrants from Africa and poverty level among females between the ages 25 and 34 in the United States with a correlation coefficient (R) of 0.372 and weighted average of 14.1%. Similarly, the statistical analysis conducted on geographies consisting of 470,128,205 people shows a moderate positive correlation between the proportion of Greeks and poverty level among females between the ages 25 and 34 in the United States with a correlation coefficient (R) of 0.419 and weighted average of 12.3%, a difference of 14.5%.
Female Poverty Among 25-34 Year Olds Correlation Summary
| Measurement | Immigrants from Africa | Greek |
| Minimum | 4.1% | 7.0% |
| Maximum | 59.3% | 100.0% |
| Range | 55.2% | 93.0% |
| Mean | 17.1% | 28.1% |
| Median | 14.7% | 11.8% |
| Interquartile 25% (IQ1) | 12.8% | 9.2% |
| Interquartile 75% (IQ3) | 18.9% | 31.6% |
| Interquartile Range (IQR) | 6.1% | 22.4% |
| Standard Deviation (Sample) | 9.2% | 29.6% |
| Standard Deviation (Population) | 9.2% | 29.1% |
Similar Demographics by Female Poverty Among 25-34 Year Olds
Demographics Similar to Immigrants from Africa by Female Poverty Among 25-34 Year Olds
In terms of female poverty among 25-34 year olds, the demographic groups most similar to Immigrants from Africa are Hawaiian (14.1%, a difference of 0.050%), Immigrants (14.0%, a difference of 0.19%), Hungarian (14.1%, a difference of 0.28%), Japanese (14.1%, a difference of 0.30%), and Immigrants from Panama (14.1%, a difference of 0.32%).
| Demographics | Rating | Rank | Female Poverty Among 25-34 Year Olds |
| Immigrants | Germany | 20.9 /100 | #198 | Fair 13.9% |
| English | 20.4 /100 | #199 | Fair 13.9% |
| Hmong | 20.3 /100 | #200 | Fair 13.9% |
| Immigrants | Trinidad and Tobago | 17.6 /100 | #201 | Poor 14.0% |
| Welsh | 17.2 /100 | #202 | Poor 14.0% |
| Immigrants | Immigrants | 14.5 /100 | #203 | Poor 14.0% |
| Hawaiians | 13.6 /100 | #204 | Poor 14.1% |
| Immigrants | Africa | 13.4 /100 | #205 | Poor 14.1% |
| Hungarians | 11.8 /100 | #206 | Poor 14.1% |
| Japanese | 11.7 /100 | #207 | Poor 14.1% |
| Immigrants | Panama | 11.6 /100 | #208 | Poor 14.1% |
| Guyanese | 8.6 /100 | #209 | Tragic 14.2% |
| Panamanians | 8.6 /100 | #210 | Tragic 14.2% |
| Trinidadians and Tobagonians | 8.2 /100 | #211 | Tragic 14.2% |
| Immigrants | Guyana | 6.6 /100 | #212 | Tragic 14.3% |
Demographics Similar to Greeks by Female Poverty Among 25-34 Year Olds
In terms of female poverty among 25-34 year olds, the demographic groups most similar to Greeks are Estonian (12.3%, a difference of 0.060%), Immigrants from Sweden (12.3%, a difference of 0.11%), Immigrants from Vietnam (12.3%, a difference of 0.14%), Immigrants from Italy (12.3%, a difference of 0.16%), and Immigrants from Ukraine (12.3%, a difference of 0.39%).
| Demographics | Rating | Rank | Female Poverty Among 25-34 Year Olds |
| Immigrants | Lebanon | 99.1 /100 | #69 | Exceptional 12.2% |
| Immigrants | Belgium | 99.1 /100 | #70 | Exceptional 12.2% |
| Immigrants | Scotland | 99.1 /100 | #71 | Exceptional 12.2% |
| Lithuanians | 99.1 /100 | #72 | Exceptional 12.2% |
| Immigrants | Vietnam | 98.9 /100 | #73 | Exceptional 12.3% |
| Immigrants | Sweden | 98.9 /100 | #74 | Exceptional 12.3% |
| Estonians | 98.9 /100 | #75 | Exceptional 12.3% |
| Greeks | 98.9 /100 | #76 | Exceptional 12.3% |
| Immigrants | Italy | 98.8 /100 | #77 | Exceptional 12.3% |
| Immigrants | Ukraine | 98.6 /100 | #78 | Exceptional 12.3% |
| Immigrants | Jordan | 98.5 /100 | #79 | Exceptional 12.4% |
| Immigrants | Malaysia | 98.3 /100 | #80 | Exceptional 12.4% |
| Immigrants | Kazakhstan | 98.1 /100 | #81 | Exceptional 12.4% |
| Ethiopians | 98.0 /100 | #82 | Exceptional 12.4% |
| Albanians | 97.7 /100 | #83 | Exceptional 12.5% |