Immigrants from England vs Immigrants from Kenya Female Poverty Among 25-34 Year Olds
COMPARE
Immigrants from England
Immigrants from Kenya
Female Poverty Among 25-34 Year Olds
Female Poverty Among 25-34 Year Olds Comparison
Immigrants from England
Immigrants from Kenya
13.0%
FEMALE POVERTY AMONG 25-34 YEAR OLDS
85.5/ 100
METRIC RATING
136th/ 347
METRIC RANK
13.8%
FEMALE POVERTY AMONG 25-34 YEAR OLDS
28.0/ 100
METRIC RATING
193rd/ 347
METRIC RANK
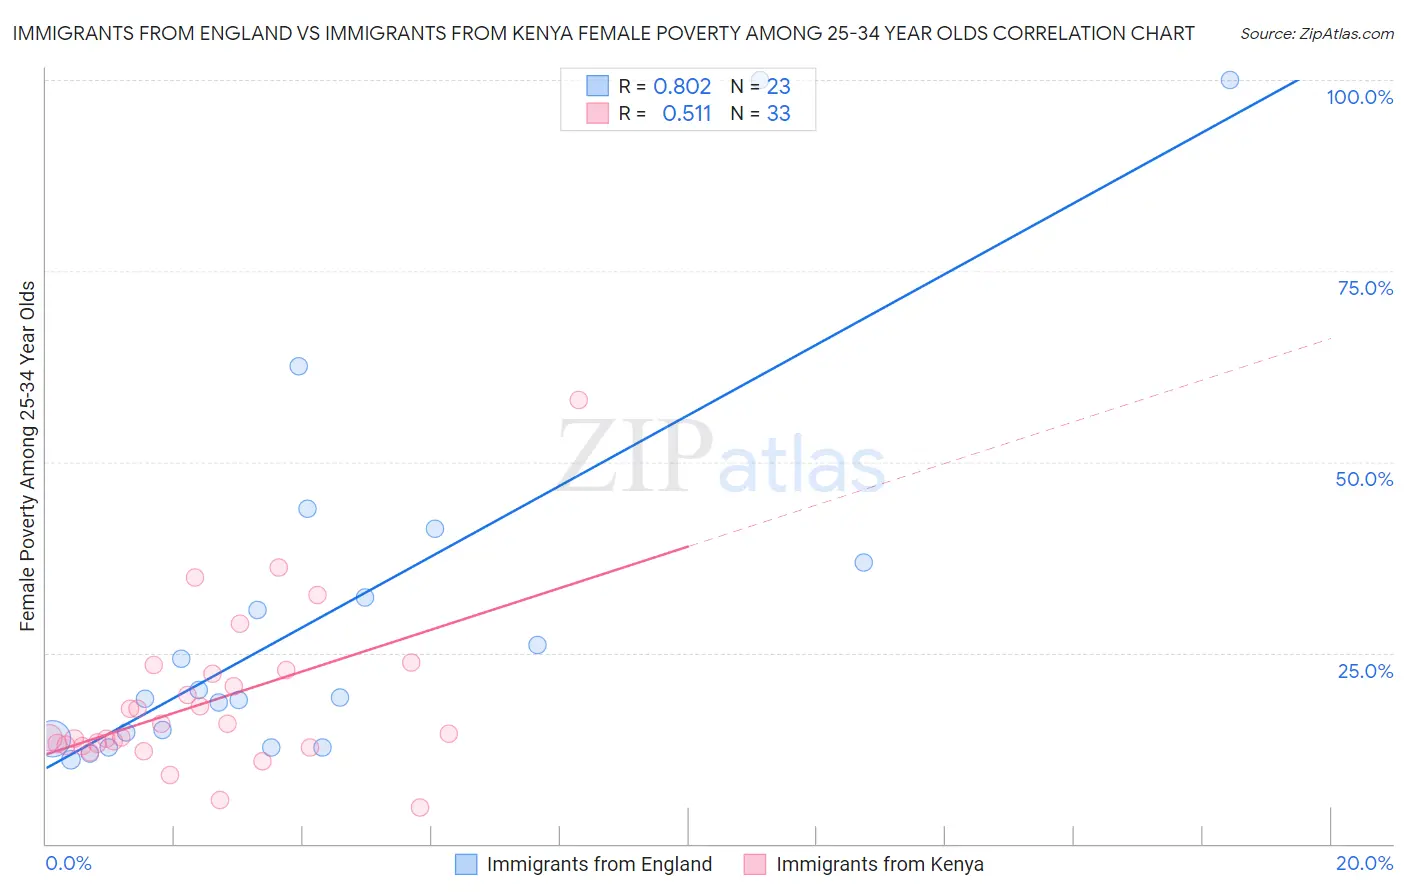
Immigrants from England vs Immigrants from Kenya Female Poverty Among 25-34 Year Olds Correlation Chart
The statistical analysis conducted on geographies consisting of 384,281,453 people shows a very strong positive correlation between the proportion of Immigrants from England and poverty level among females between the ages 25 and 34 in the United States with a correlation coefficient (R) of 0.802 and weighted average of 13.0%. Similarly, the statistical analysis conducted on geographies consisting of 216,558,558 people shows a substantial positive correlation between the proportion of Immigrants from Kenya and poverty level among females between the ages 25 and 34 in the United States with a correlation coefficient (R) of 0.511 and weighted average of 13.8%, a difference of 5.9%.
Female Poverty Among 25-34 Year Olds Correlation Summary
| Measurement | Immigrants from England | Immigrants from Kenya |
| Minimum | 11.0% | 4.8% |
| Maximum | 100.0% | 58.1% |
| Range | 89.0% | 53.3% |
| Mean | 30.3% | 18.5% |
| Median | 19.1% | 14.4% |
| Interquartile 25% (IQ1) | 13.7% | 12.8% |
| Interquartile 75% (IQ3) | 36.8% | 22.5% |
| Interquartile Range (IQR) | 23.1% | 9.7% |
| Standard Deviation (Sample) | 25.4% | 10.3% |
| Standard Deviation (Population) | 24.8% | 10.2% |
Similar Demographics by Female Poverty Among 25-34 Year Olds
Demographics Similar to Immigrants from England by Female Poverty Among 25-34 Year Olds
In terms of female poverty among 25-34 year olds, the demographic groups most similar to Immigrants from England are South African (13.0%, a difference of 0.020%), Afghan (13.0%, a difference of 0.040%), Immigrants from Chile (13.1%, a difference of 0.16%), Brazilian (13.1%, a difference of 0.17%), and Austrian (13.1%, a difference of 0.30%).
| Demographics | Rating | Rank | Female Poverty Among 25-34 Year Olds |
| Immigrants | North America | 89.7 /100 | #129 | Excellent 12.9% |
| Immigrants | Uzbekistan | 89.6 /100 | #130 | Excellent 12.9% |
| Pakistanis | 88.4 /100 | #131 | Excellent 13.0% |
| Immigrants | Hungary | 88.3 /100 | #132 | Excellent 13.0% |
| Serbians | 87.6 /100 | #133 | Excellent 13.0% |
| Afghans | 85.8 /100 | #134 | Excellent 13.0% |
| South Africans | 85.7 /100 | #135 | Excellent 13.0% |
| Immigrants | England | 85.5 /100 | #136 | Excellent 13.0% |
| Immigrants | Chile | 84.6 /100 | #137 | Excellent 13.1% |
| Brazilians | 84.5 /100 | #138 | Excellent 13.1% |
| Austrians | 83.7 /100 | #139 | Excellent 13.1% |
| Immigrants | Iraq | 83.6 /100 | #140 | Excellent 13.1% |
| New Zealanders | 83.4 /100 | #141 | Excellent 13.1% |
| Scandinavians | 82.3 /100 | #142 | Excellent 13.1% |
| Israelis | 81.9 /100 | #143 | Excellent 13.1% |
Demographics Similar to Immigrants from Kenya by Female Poverty Among 25-34 Year Olds
In terms of female poverty among 25-34 year olds, the demographic groups most similar to Immigrants from Kenya are Tlingit-Haida (13.8%, a difference of 0.010%), Immigrants from St. Vincent and the Grenadines (13.8%, a difference of 0.14%), Dutch (13.8%, a difference of 0.17%), Moroccan (13.8%, a difference of 0.31%), and Immigrants from Cambodia (13.9%, a difference of 0.42%).
| Demographics | Rating | Rank | Female Poverty Among 25-34 Year Olds |
| Immigrants | Uruguay | 34.1 /100 | #186 | Fair 13.7% |
| Slovaks | 34.1 /100 | #187 | Fair 13.7% |
| Immigrants | Eritrea | 32.7 /100 | #188 | Fair 13.7% |
| Finns | 32.5 /100 | #189 | Fair 13.7% |
| Dutch | 29.7 /100 | #190 | Fair 13.8% |
| Immigrants | St. Vincent and the Grenadines | 29.3 /100 | #191 | Fair 13.8% |
| Tlingit-Haida | 28.1 /100 | #192 | Fair 13.8% |
| Immigrants | Kenya | 28.0 /100 | #193 | Fair 13.8% |
| Moroccans | 25.1 /100 | #194 | Fair 13.8% |
| Immigrants | Cambodia | 24.0 /100 | #195 | Fair 13.9% |
| Scottish | 23.6 /100 | #196 | Fair 13.9% |
| Immigrants | Saudi Arabia | 21.9 /100 | #197 | Fair 13.9% |
| Immigrants | Germany | 20.9 /100 | #198 | Fair 13.9% |
| English | 20.4 /100 | #199 | Fair 13.9% |
| Hmong | 20.3 /100 | #200 | Fair 13.9% |