Immigrants from England vs Czech Female Poverty Among 18-24 Year Olds
COMPARE
Immigrants from England
Czech
Female Poverty Among 18-24 Year Olds
Female Poverty Among 18-24 Year Olds Comparison
Immigrants from England
Czechs
19.5%
FEMALE POVERTY AMONG 18-24 YEAR OLDS
92.9/ 100
METRIC RATING
129th/ 347
METRIC RANK
20.4%
FEMALE POVERTY AMONG 18-24 YEAR OLDS
22.3/ 100
METRIC RATING
196th/ 347
METRIC RANK
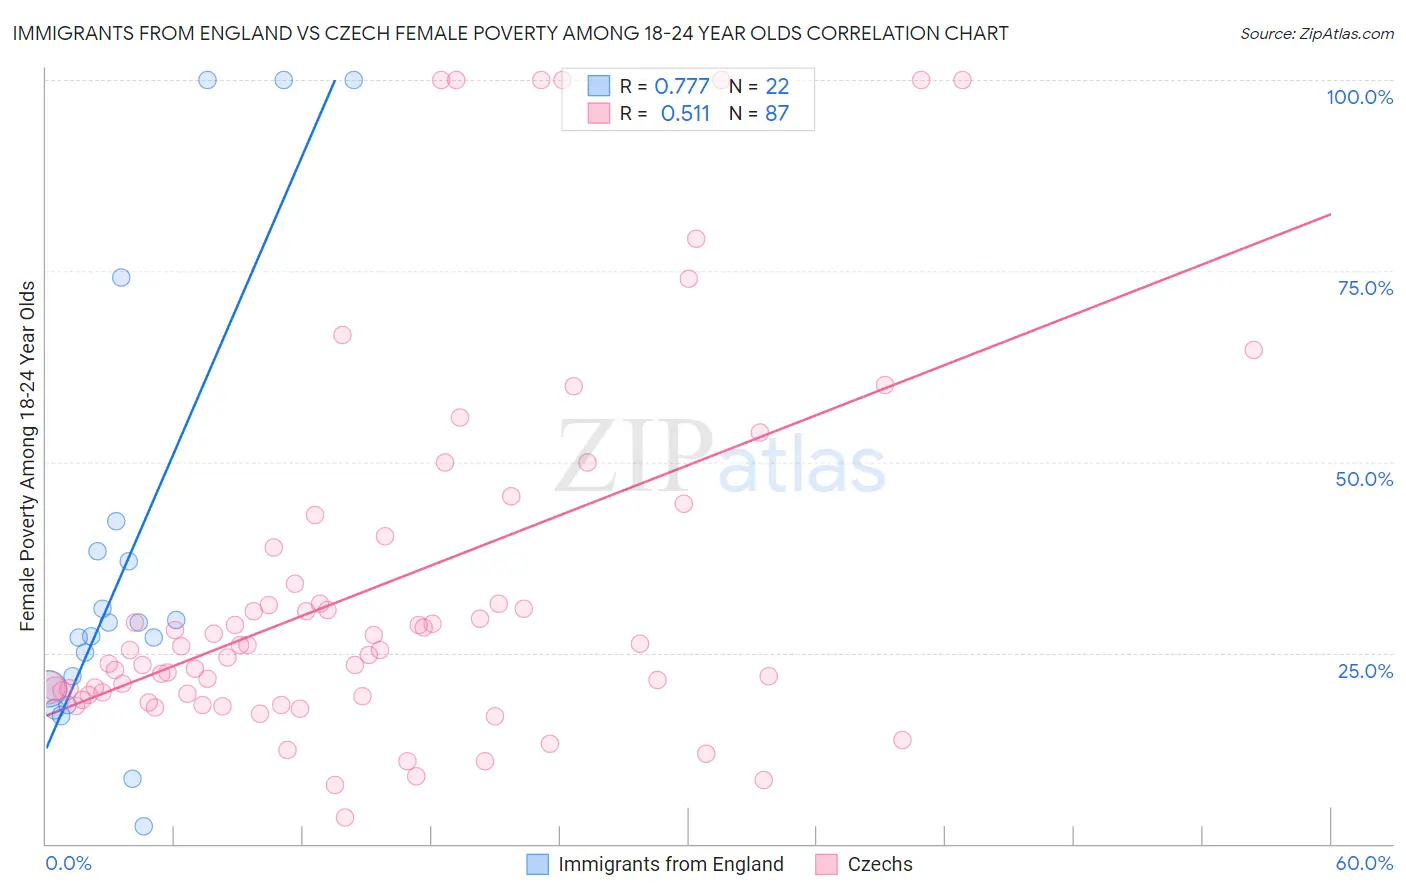
Immigrants from England vs Czech Female Poverty Among 18-24 Year Olds Correlation Chart
The statistical analysis conducted on geographies consisting of 380,023,183 people shows a strong positive correlation between the proportion of Immigrants from England and poverty level among females between the ages 18 and 24 in the United States with a correlation coefficient (R) of 0.777 and weighted average of 19.5%. Similarly, the statistical analysis conducted on geographies consisting of 464,095,157 people shows a substantial positive correlation between the proportion of Czechs and poverty level among females between the ages 18 and 24 in the United States with a correlation coefficient (R) of 0.511 and weighted average of 20.4%, a difference of 4.8%.
Female Poverty Among 18-24 Year Olds Correlation Summary
| Measurement | Immigrants from England | Czech |
| Minimum | 2.2% | 3.4% |
| Maximum | 100.0% | 100.0% |
| Range | 97.8% | 96.6% |
| Mean | 37.3% | 33.8% |
| Median | 28.1% | 25.4% |
| Interquartile 25% (IQ1) | 20.3% | 19.5% |
| Interquartile 75% (IQ3) | 38.2% | 38.8% |
| Interquartile Range (IQR) | 18.0% | 19.3% |
| Standard Deviation (Sample) | 29.0% | 24.6% |
| Standard Deviation (Population) | 28.3% | 24.4% |
Similar Demographics by Female Poverty Among 18-24 Year Olds
Demographics Similar to Immigrants from England by Female Poverty Among 18-24 Year Olds
In terms of female poverty among 18-24 year olds, the demographic groups most similar to Immigrants from England are Slovak (19.5%, a difference of 0.0%), Immigrants from Canada (19.5%, a difference of 0.0%), Latvian (19.5%, a difference of 0.040%), Cape Verdean (19.4%, a difference of 0.14%), and Jamaican (19.5%, a difference of 0.15%).
| Demographics | Rating | Rank | Female Poverty Among 18-24 Year Olds |
| Cambodians | 94.6 /100 | #122 | Exceptional 19.4% |
| Paraguayans | 94.6 /100 | #123 | Exceptional 19.4% |
| Immigrants | Chile | 94.3 /100 | #124 | Exceptional 19.4% |
| Immigrants | Panama | 94.0 /100 | #125 | Exceptional 19.4% |
| Immigrants | Russia | 93.7 /100 | #126 | Exceptional 19.4% |
| Cape Verdeans | 93.6 /100 | #127 | Exceptional 19.4% |
| Slovaks | 92.9 /100 | #128 | Exceptional 19.5% |
| Immigrants | England | 92.9 /100 | #129 | Exceptional 19.5% |
| Immigrants | Canada | 92.9 /100 | #130 | Exceptional 19.5% |
| Latvians | 92.7 /100 | #131 | Exceptional 19.5% |
| Jamaicans | 92.1 /100 | #132 | Exceptional 19.5% |
| Turks | 92.1 /100 | #133 | Exceptional 19.5% |
| Immigrants | North America | 92.1 /100 | #134 | Exceptional 19.5% |
| Soviet Union | 92.0 /100 | #135 | Exceptional 19.5% |
| Russians | 91.5 /100 | #136 | Exceptional 19.5% |
Demographics Similar to Czechs by Female Poverty Among 18-24 Year Olds
In terms of female poverty among 18-24 year olds, the demographic groups most similar to Czechs are Immigrants from Latvia (20.4%, a difference of 0.050%), Mexican American Indian (20.4%, a difference of 0.060%), Nigerian (20.4%, a difference of 0.070%), Zimbabwean (20.4%, a difference of 0.090%), and Immigrants from Spain (20.4%, a difference of 0.12%).
| Demographics | Rating | Rank | Female Poverty Among 18-24 Year Olds |
| Immigrants | Germany | 34.0 /100 | #189 | Fair 20.3% |
| Immigrants | Western Asia | 29.3 /100 | #190 | Fair 20.3% |
| Moroccans | 25.8 /100 | #191 | Fair 20.4% |
| Immigrants | Israel | 24.4 /100 | #192 | Fair 20.4% |
| Nigerians | 23.4 /100 | #193 | Fair 20.4% |
| Mexican American Indians | 23.2 /100 | #194 | Fair 20.4% |
| Immigrants | Latvia | 23.0 /100 | #195 | Fair 20.4% |
| Czechs | 22.3 /100 | #196 | Fair 20.4% |
| Zimbabweans | 21.0 /100 | #197 | Fair 20.4% |
| Immigrants | Spain | 20.7 /100 | #198 | Fair 20.4% |
| Germans | 20.6 /100 | #199 | Fair 20.4% |
| Europeans | 19.9 /100 | #200 | Poor 20.4% |
| Mexicans | 18.3 /100 | #201 | Poor 20.5% |
| Immigrants | Turkey | 17.7 /100 | #202 | Poor 20.5% |
| Immigrants | Malaysia | 17.2 /100 | #203 | Poor 20.5% |