Immigrants from Eastern Europe vs Turkish In Labor Force | Age 20-64
COMPARE
Immigrants from Eastern Europe
Turkish
In Labor Force | Age 20-64
In Labor Force | Age 20-64 Comparison
Immigrants from Eastern Europe
Turks
80.2%
IN LABOR FORCE | AGE 20-64
98.1/ 100
METRIC RATING
74th/ 347
METRIC RANK
80.3%
IN LABOR FORCE | AGE 20-64
99.2/ 100
METRIC RATING
52nd/ 347
METRIC RANK
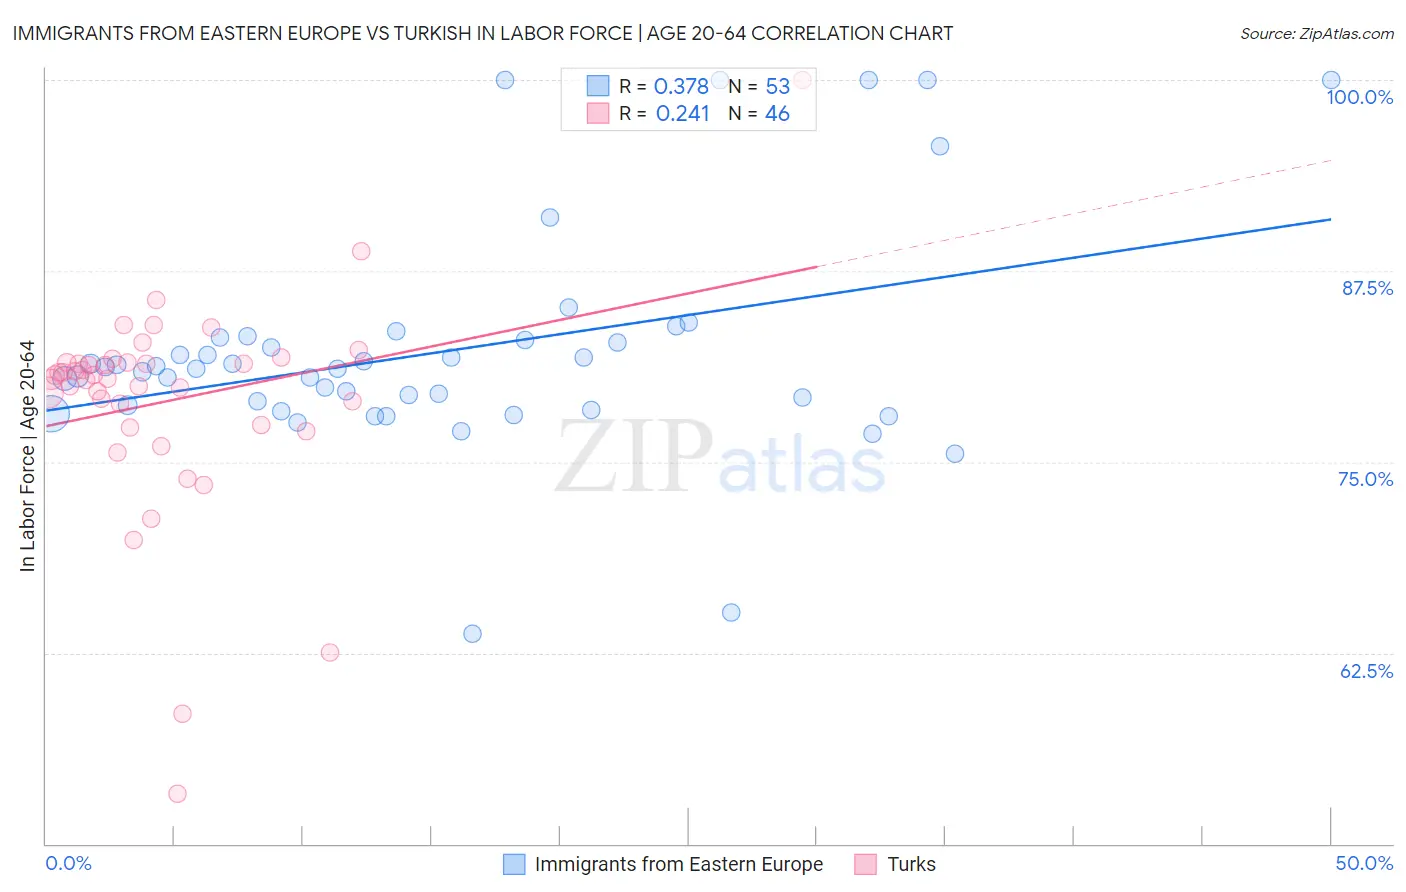
Immigrants from Eastern Europe vs Turkish In Labor Force | Age 20-64 Correlation Chart
The statistical analysis conducted on geographies consisting of 475,884,691 people shows a mild positive correlation between the proportion of Immigrants from Eastern Europe and labor force participation rate among population between the ages 20 and 64 in the United States with a correlation coefficient (R) of 0.378 and weighted average of 80.2%. Similarly, the statistical analysis conducted on geographies consisting of 271,859,072 people shows a weak positive correlation between the proportion of Turks and labor force participation rate among population between the ages 20 and 64 in the United States with a correlation coefficient (R) of 0.241 and weighted average of 80.3%, a difference of 0.19%.
In Labor Force | Age 20-64 Correlation Summary
| Measurement | Immigrants from Eastern Europe | Turkish |
| Minimum | 63.7% | 53.3% |
| Maximum | 100.0% | 100.0% |
| Range | 36.3% | 46.7% |
| Mean | 82.2% | 79.0% |
| Median | 81.1% | 80.6% |
| Interquartile 25% (IQ1) | 78.6% | 77.4% |
| Interquartile 75% (IQ3) | 83.1% | 81.5% |
| Interquartile Range (IQR) | 4.5% | 4.1% |
| Standard Deviation (Sample) | 7.4% | 7.2% |
| Standard Deviation (Population) | 7.3% | 7.1% |
Similar Demographics by In Labor Force | Age 20-64
Demographics Similar to Immigrants from Eastern Europe by In Labor Force | Age 20-64
In terms of in labor force | age 20-64, the demographic groups most similar to Immigrants from Eastern Europe are Cypriot (80.2%, a difference of 0.010%), Immigrants from Afghanistan (80.2%, a difference of 0.010%), Egyptian (80.2%, a difference of 0.030%), Immigrants from Colombia (80.2%, a difference of 0.030%), and Immigrants from Romania (80.2%, a difference of 0.030%).
| Demographics | Rating | Rank | In Labor Force | Age 20-64 |
| Taiwanese | 98.6 /100 | #67 | Exceptional 80.2% |
| Bhutanese | 98.6 /100 | #68 | Exceptional 80.2% |
| Albanians | 98.6 /100 | #69 | Exceptional 80.2% |
| Immigrants | Turkey | 98.5 /100 | #70 | Exceptional 80.2% |
| Soviet Union | 98.5 /100 | #71 | Exceptional 80.2% |
| Eastern Europeans | 98.4 /100 | #72 | Exceptional 80.2% |
| Cypriots | 98.2 /100 | #73 | Exceptional 80.2% |
| Immigrants | Eastern Europe | 98.1 /100 | #74 | Exceptional 80.2% |
| Immigrants | Afghanistan | 97.9 /100 | #75 | Exceptional 80.2% |
| Egyptians | 97.8 /100 | #76 | Exceptional 80.2% |
| Immigrants | Colombia | 97.8 /100 | #77 | Exceptional 80.2% |
| Immigrants | Romania | 97.8 /100 | #78 | Exceptional 80.2% |
| Asians | 97.7 /100 | #79 | Exceptional 80.2% |
| Immigrants | Croatia | 97.6 /100 | #80 | Exceptional 80.1% |
| German Russians | 97.3 /100 | #81 | Exceptional 80.1% |
Demographics Similar to Turks by In Labor Force | Age 20-64
In terms of in labor force | age 20-64, the demographic groups most similar to Turks are Immigrants from Sri Lanka (80.4%, a difference of 0.020%), Immigrants from Peru (80.3%, a difference of 0.020%), Peruvian (80.3%, a difference of 0.030%), Immigrants from Sudan (80.4%, a difference of 0.040%), and Immigrants from Cabo Verde (80.3%, a difference of 0.050%).
| Demographics | Rating | Rank | In Labor Force | Age 20-64 |
| Slovenes | 99.7 /100 | #45 | Exceptional 80.5% |
| Immigrants | Pakistan | 99.6 /100 | #46 | Exceptional 80.5% |
| Immigrants | Africa | 99.6 /100 | #47 | Exceptional 80.4% |
| Immigrants | Hong Kong | 99.5 /100 | #48 | Exceptional 80.4% |
| Immigrants | Greece | 99.4 /100 | #49 | Exceptional 80.4% |
| Immigrants | Sudan | 99.4 /100 | #50 | Exceptional 80.4% |
| Immigrants | Sri Lanka | 99.3 /100 | #51 | Exceptional 80.4% |
| Turks | 99.2 /100 | #52 | Exceptional 80.3% |
| Immigrants | Peru | 99.2 /100 | #53 | Exceptional 80.3% |
| Peruvians | 99.1 /100 | #54 | Exceptional 80.3% |
| Immigrants | Cabo Verde | 99.0 /100 | #55 | Exceptional 80.3% |
| Immigrants | Northern Africa | 99.0 /100 | #56 | Exceptional 80.3% |
| Afghans | 98.9 /100 | #57 | Exceptional 80.3% |
| Serbians | 98.9 /100 | #58 | Exceptional 80.3% |
| Swedes | 98.9 /100 | #59 | Exceptional 80.3% |