Immigrants from Eastern Africa vs Ute Child Poverty Among Girls Under 16
COMPARE
Immigrants from Eastern Africa
Ute
Child Poverty Among Girls Under 16
Child Poverty Among Girls Under 16 Comparison
Immigrants from Eastern Africa
Ute
17.7%
CHILD POVERTY AMONG GIRLS UNDER 16
6.4/ 100
METRIC RATING
211th/ 347
METRIC RANK
21.8%
CHILD POVERTY AMONG GIRLS UNDER 16
0.0/ 100
METRIC RATING
315th/ 347
METRIC RANK
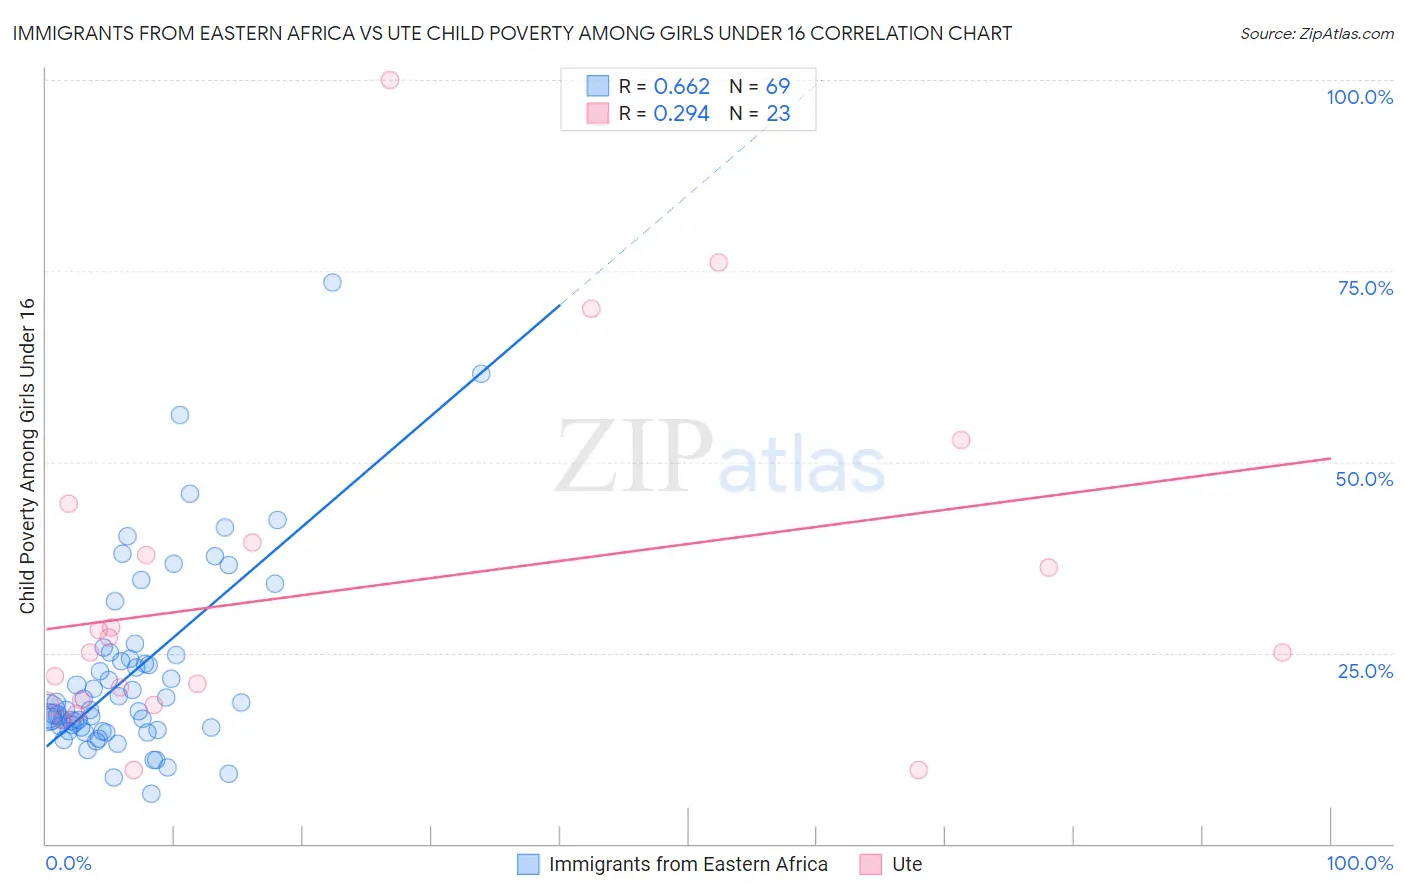
Immigrants from Eastern Africa vs Ute Child Poverty Among Girls Under 16 Correlation Chart
The statistical analysis conducted on geographies consisting of 350,243,206 people shows a significant positive correlation between the proportion of Immigrants from Eastern Africa and poverty level among girls under the age of 16 in the United States with a correlation coefficient (R) of 0.662 and weighted average of 17.7%. Similarly, the statistical analysis conducted on geographies consisting of 55,563,406 people shows a weak positive correlation between the proportion of Ute and poverty level among girls under the age of 16 in the United States with a correlation coefficient (R) of 0.294 and weighted average of 21.8%, a difference of 22.9%.
Child Poverty Among Girls Under 16 Correlation Summary
| Measurement | Immigrants from Eastern Africa | Ute |
| Minimum | 6.5% | 9.6% |
| Maximum | 73.5% | 100.0% |
| Range | 67.0% | 90.4% |
| Mean | 22.6% | 33.1% |
| Median | 17.6% | 25.0% |
| Interquartile 25% (IQ1) | 15.0% | 18.3% |
| Interquartile 75% (IQ3) | 24.9% | 39.5% |
| Interquartile Range (IQR) | 9.9% | 21.2% |
| Standard Deviation (Sample) | 12.6% | 22.6% |
| Standard Deviation (Population) | 12.5% | 22.1% |
Similar Demographics by Child Poverty Among Girls Under 16
Demographics Similar to Immigrants from Eastern Africa by Child Poverty Among Girls Under 16
In terms of child poverty among girls under 16, the demographic groups most similar to Immigrants from Eastern Africa are Immigrants from Thailand (17.7%, a difference of 0.050%), Pennsylvania German (17.8%, a difference of 0.31%), Malaysian (17.8%, a difference of 0.33%), German Russian (17.8%, a difference of 0.33%), and Immigrants (17.7%, a difference of 0.39%).
| Demographics | Rating | Rank | Child Poverty Among Girls Under 16 |
| Iraqis | 13.0 /100 | #204 | Poor 17.4% |
| Immigrants | Cameroon | 12.6 /100 | #205 | Poor 17.4% |
| Delaware | 11.5 /100 | #206 | Poor 17.4% |
| Hmong | 10.6 /100 | #207 | Poor 17.5% |
| Sierra Leoneans | 8.9 /100 | #208 | Tragic 17.6% |
| Panamanians | 8.7 /100 | #209 | Tragic 17.6% |
| Immigrants | Immigrants | 7.3 /100 | #210 | Tragic 17.7% |
| Immigrants | Eastern Africa | 6.4 /100 | #211 | Tragic 17.7% |
| Immigrants | Thailand | 6.3 /100 | #212 | Tragic 17.7% |
| Pennsylvania Germans | 5.7 /100 | #213 | Tragic 17.8% |
| Malaysians | 5.7 /100 | #214 | Tragic 17.8% |
| German Russians | 5.7 /100 | #215 | Tragic 17.8% |
| Moroccans | 5.5 /100 | #216 | Tragic 17.8% |
| Japanese | 5.3 /100 | #217 | Tragic 17.8% |
| Alaska Natives | 5.2 /100 | #218 | Tragic 17.8% |
Demographics Similar to Ute by Child Poverty Among Girls Under 16
In terms of child poverty among girls under 16, the demographic groups most similar to Ute are Immigrants from Guatemala (21.9%, a difference of 0.27%), Arapaho (21.7%, a difference of 0.28%), Creek (21.7%, a difference of 0.29%), African (21.9%, a difference of 0.59%), and Immigrants from Mexico (21.6%, a difference of 0.80%).
| Demographics | Rating | Rank | Child Poverty Among Girls Under 16 |
| Houma | 0.0 /100 | #308 | Tragic 21.5% |
| Bahamians | 0.0 /100 | #309 | Tragic 21.5% |
| Immigrants | Somalia | 0.0 /100 | #310 | Tragic 21.6% |
| Dutch West Indians | 0.0 /100 | #311 | Tragic 21.6% |
| Immigrants | Mexico | 0.0 /100 | #312 | Tragic 21.6% |
| Creek | 0.0 /100 | #313 | Tragic 21.7% |
| Arapaho | 0.0 /100 | #314 | Tragic 21.7% |
| Ute | 0.0 /100 | #315 | Tragic 21.8% |
| Immigrants | Guatemala | 0.0 /100 | #316 | Tragic 21.9% |
| Africans | 0.0 /100 | #317 | Tragic 21.9% |
| Immigrants | Dominica | 0.0 /100 | #318 | Tragic 22.1% |
| U.S. Virgin Islanders | 0.0 /100 | #319 | Tragic 22.1% |
| Hondurans | 0.0 /100 | #320 | Tragic 22.2% |
| Colville | 0.0 /100 | #321 | Tragic 22.5% |
| Yakama | 0.0 /100 | #322 | Tragic 22.6% |