Immigrants from Eastern Africa vs Immigrants from Zaire Female Poverty Among 25-34 Year Olds
COMPARE
Immigrants from Eastern Africa
Immigrants from Zaire
Female Poverty Among 25-34 Year Olds
Female Poverty Among 25-34 Year Olds Comparison
Immigrants from Eastern Africa
Immigrants from Zaire
13.6%
FEMALE POVERTY AMONG 25-34 YEAR OLDS
43.6/ 100
METRIC RATING
179th/ 347
METRIC RANK
15.8%
FEMALE POVERTY AMONG 25-34 YEAR OLDS
0.0/ 100
METRIC RATING
276th/ 347
METRIC RANK
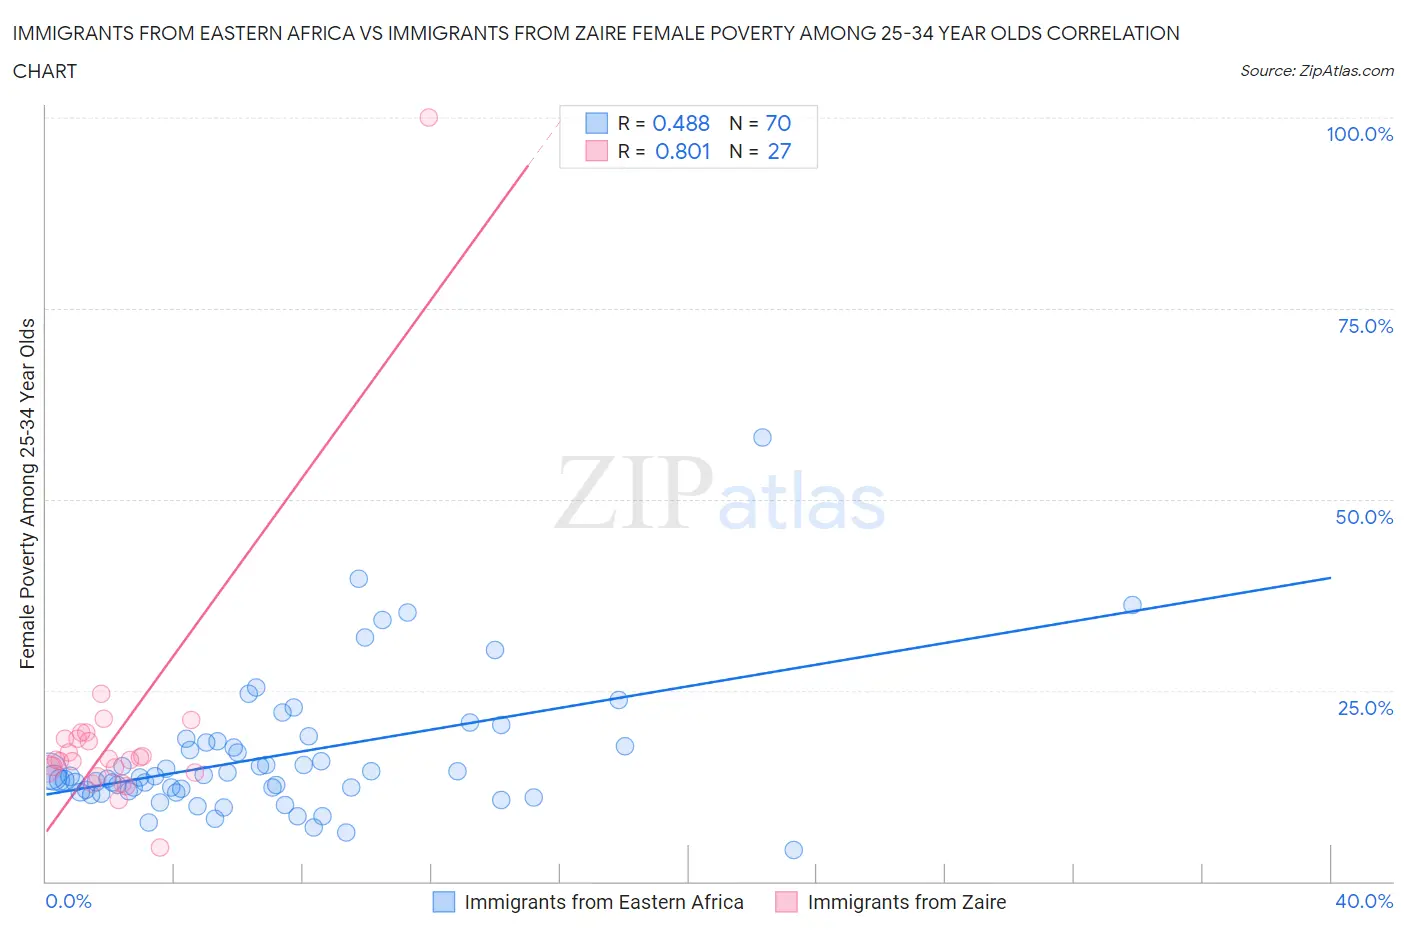
Immigrants from Eastern Africa vs Immigrants from Zaire Female Poverty Among 25-34 Year Olds Correlation Chart
The statistical analysis conducted on geographies consisting of 350,717,935 people shows a moderate positive correlation between the proportion of Immigrants from Eastern Africa and poverty level among females between the ages 25 and 34 in the United States with a correlation coefficient (R) of 0.488 and weighted average of 13.6%. Similarly, the statistical analysis conducted on geographies consisting of 106,944,987 people shows a very strong positive correlation between the proportion of Immigrants from Zaire and poverty level among females between the ages 25 and 34 in the United States with a correlation coefficient (R) of 0.801 and weighted average of 15.8%, a difference of 16.4%.
Female Poverty Among 25-34 Year Olds Correlation Summary
| Measurement | Immigrants from Eastern Africa | Immigrants from Zaire |
| Minimum | 4.1% | 4.4% |
| Maximum | 58.1% | 100.0% |
| Range | 53.9% | 95.6% |
| Mean | 16.4% | 19.1% |
| Median | 13.7% | 15.9% |
| Interquartile 25% (IQ1) | 11.8% | 14.3% |
| Interquartile 75% (IQ3) | 18.1% | 18.6% |
| Interquartile Range (IQR) | 6.3% | 4.3% |
| Standard Deviation (Sample) | 8.8% | 16.6% |
| Standard Deviation (Population) | 8.7% | 16.3% |
Similar Demographics by Female Poverty Among 25-34 Year Olds
Demographics Similar to Immigrants from Eastern Africa by Female Poverty Among 25-34 Year Olds
In terms of female poverty among 25-34 year olds, the demographic groups most similar to Immigrants from Eastern Africa are Canadian (13.6%, a difference of 0.060%), Venezuelan (13.6%, a difference of 0.090%), Yugoslavian (13.6%, a difference of 0.12%), German (13.6%, a difference of 0.17%), and Guamanian/Chamorro (13.6%, a difference of 0.17%).
| Demographics | Rating | Rank | Female Poverty Among 25-34 Year Olds |
| Immigrants | Costa Rica | 51.9 /100 | #172 | Average 13.5% |
| Kenyans | 51.8 /100 | #173 | Average 13.5% |
| Immigrants | Oceania | 50.0 /100 | #174 | Average 13.5% |
| Bermudans | 46.8 /100 | #175 | Average 13.6% |
| Yugoslavians | 45.0 /100 | #176 | Average 13.6% |
| Venezuelans | 44.6 /100 | #177 | Average 13.6% |
| Canadians | 44.3 /100 | #178 | Average 13.6% |
| Immigrants | Eastern Africa | 43.6 /100 | #179 | Average 13.6% |
| Germans | 41.6 /100 | #180 | Average 13.6% |
| Guamanians/Chamorros | 41.5 /100 | #181 | Average 13.6% |
| Immigrants | Venezuela | 40.7 /100 | #182 | Average 13.6% |
| Portuguese | 40.3 /100 | #183 | Average 13.6% |
| Czechoslovakians | 36.8 /100 | #184 | Fair 13.7% |
| Irish | 35.3 /100 | #185 | Fair 13.7% |
| Immigrants | Uruguay | 34.1 /100 | #186 | Fair 13.7% |
Demographics Similar to Immigrants from Zaire by Female Poverty Among 25-34 Year Olds
In terms of female poverty among 25-34 year olds, the demographic groups most similar to Immigrants from Zaire are Immigrants from Micronesia (15.8%, a difference of 0.010%), French American Indian (15.9%, a difference of 0.30%), Fijian (15.9%, a difference of 0.30%), Immigrants from the Azores (15.8%, a difference of 0.42%), and Bangladeshi (15.9%, a difference of 0.46%).
| Demographics | Rating | Rank | Female Poverty Among 25-34 Year Olds |
| Sub-Saharan Africans | 0.1 /100 | #269 | Tragic 15.6% |
| British West Indians | 0.1 /100 | #270 | Tragic 15.6% |
| Cree | 0.1 /100 | #271 | Tragic 15.6% |
| Senegalese | 0.1 /100 | #272 | Tragic 15.6% |
| Immigrants | Nonimmigrants | 0.1 /100 | #273 | Tragic 15.6% |
| Immigrants | Caribbean | 0.0 /100 | #274 | Tragic 15.7% |
| Immigrants | Azores | 0.0 /100 | #275 | Tragic 15.8% |
| Immigrants | Zaire | 0.0 /100 | #276 | Tragic 15.8% |
| Immigrants | Micronesia | 0.0 /100 | #277 | Tragic 15.8% |
| French American Indians | 0.0 /100 | #278 | Tragic 15.9% |
| Fijians | 0.0 /100 | #279 | Tragic 15.9% |
| Bangladeshis | 0.0 /100 | #280 | Tragic 15.9% |
| Immigrants | Latin America | 0.0 /100 | #281 | Tragic 16.0% |
| Aleuts | 0.0 /100 | #282 | Tragic 16.1% |
| Bahamians | 0.0 /100 | #283 | Tragic 16.1% |