Immigrants from Czechoslovakia vs Immigrants from Canada Child Poverty Among Girls Under 16
COMPARE
Immigrants from Czechoslovakia
Immigrants from Canada
Child Poverty Among Girls Under 16
Child Poverty Among Girls Under 16 Comparison
Immigrants from Czechoslovakia
Immigrants from Canada
14.2%
CHILD POVERTY AMONG GIRLS UNDER 16
99.3/ 100
METRIC RATING
47th/ 347
METRIC RANK
14.8%
CHILD POVERTY AMONG GIRLS UNDER 16
97.1/ 100
METRIC RATING
88th/ 347
METRIC RANK
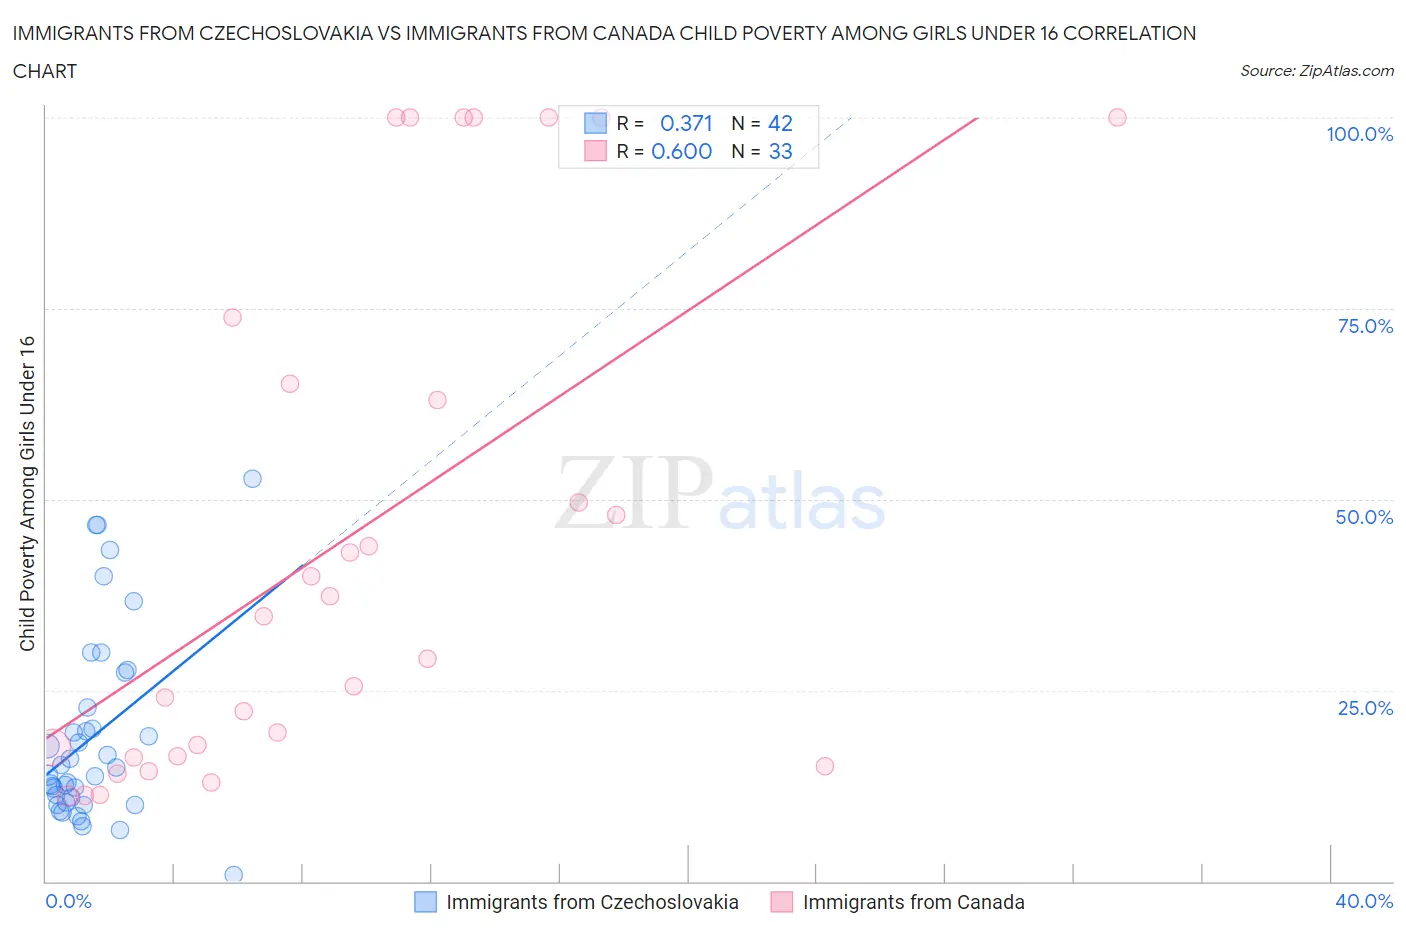
Immigrants from Czechoslovakia vs Immigrants from Canada Child Poverty Among Girls Under 16 Correlation Chart
The statistical analysis conducted on geographies consisting of 192,771,534 people shows a mild positive correlation between the proportion of Immigrants from Czechoslovakia and poverty level among girls under the age of 16 in the United States with a correlation coefficient (R) of 0.371 and weighted average of 14.2%. Similarly, the statistical analysis conducted on geographies consisting of 446,973,895 people shows a substantial positive correlation between the proportion of Immigrants from Canada and poverty level among girls under the age of 16 in the United States with a correlation coefficient (R) of 0.600 and weighted average of 14.8%, a difference of 4.6%.
Child Poverty Among Girls Under 16 Correlation Summary
| Measurement | Immigrants from Czechoslovakia | Immigrants from Canada |
| Minimum | 0.88% | 11.2% |
| Maximum | 52.8% | 100.0% |
| Range | 51.9% | 88.8% |
| Mean | 18.9% | 44.8% |
| Median | 14.4% | 34.8% |
| Interquartile 25% (IQ1) | 10.3% | 16.3% |
| Interquartile 75% (IQ3) | 22.7% | 69.5% |
| Interquartile Range (IQR) | 12.4% | 53.2% |
| Standard Deviation (Sample) | 12.4% | 33.3% |
| Standard Deviation (Population) | 12.2% | 32.8% |
Similar Demographics by Child Poverty Among Girls Under 16
Demographics Similar to Immigrants from Czechoslovakia by Child Poverty Among Girls Under 16
In terms of child poverty among girls under 16, the demographic groups most similar to Immigrants from Czechoslovakia are Czech (14.2%, a difference of 0.020%), Croatian (14.1%, a difference of 0.030%), Immigrants from Greece (14.1%, a difference of 0.060%), Greek (14.2%, a difference of 0.060%), and Immigrants from Israel (14.2%, a difference of 0.12%).
| Demographics | Rating | Rank | Child Poverty Among Girls Under 16 |
| Immigrants | Sri Lanka | 99.5 /100 | #40 | Exceptional 14.0% |
| Immigrants | Bolivia | 99.5 /100 | #41 | Exceptional 14.0% |
| Immigrants | Scotland | 99.4 /100 | #42 | Exceptional 14.0% |
| Koreans | 99.4 /100 | #43 | Exceptional 14.1% |
| Immigrants | Asia | 99.4 /100 | #44 | Exceptional 14.1% |
| Immigrants | Greece | 99.3 /100 | #45 | Exceptional 14.1% |
| Croatians | 99.3 /100 | #46 | Exceptional 14.1% |
| Immigrants | Czechoslovakia | 99.3 /100 | #47 | Exceptional 14.2% |
| Czechs | 99.3 /100 | #48 | Exceptional 14.2% |
| Greeks | 99.2 /100 | #49 | Exceptional 14.2% |
| Immigrants | Israel | 99.2 /100 | #50 | Exceptional 14.2% |
| Immigrants | Pakistan | 99.1 /100 | #51 | Exceptional 14.2% |
| Italians | 99.1 /100 | #52 | Exceptional 14.3% |
| Luxembourgers | 99.0 /100 | #53 | Exceptional 14.3% |
| Estonians | 98.9 /100 | #54 | Exceptional 14.3% |
Demographics Similar to Immigrants from Canada by Child Poverty Among Girls Under 16
In terms of child poverty among girls under 16, the demographic groups most similar to Immigrants from Canada are Jordanian (14.8%, a difference of 0.050%), Finnish (14.8%, a difference of 0.070%), Northern European (14.8%, a difference of 0.070%), Australian (14.8%, a difference of 0.090%), and Immigrants from Belarus (14.8%, a difference of 0.11%).
| Demographics | Rating | Rank | Child Poverty Among Girls Under 16 |
| Ukrainians | 97.7 /100 | #81 | Exceptional 14.7% |
| Macedonians | 97.6 /100 | #82 | Exceptional 14.7% |
| Immigrants | Italy | 97.4 /100 | #83 | Exceptional 14.8% |
| Soviet Union | 97.3 /100 | #84 | Exceptional 14.8% |
| Swiss | 97.2 /100 | #85 | Exceptional 14.8% |
| Australians | 97.2 /100 | #86 | Exceptional 14.8% |
| Finns | 97.2 /100 | #87 | Exceptional 14.8% |
| Immigrants | Canada | 97.1 /100 | #88 | Exceptional 14.8% |
| Jordanians | 97.1 /100 | #89 | Exceptional 14.8% |
| Northern Europeans | 97.0 /100 | #90 | Exceptional 14.8% |
| Immigrants | Belarus | 97.0 /100 | #91 | Exceptional 14.8% |
| Austrians | 96.7 /100 | #92 | Exceptional 14.9% |
| Immigrants | North America | 96.6 /100 | #93 | Exceptional 14.9% |
| Immigrants | Switzerland | 96.3 /100 | #94 | Exceptional 14.9% |
| Germans | 96.3 /100 | #95 | Exceptional 14.9% |