Immigrants from Czechoslovakia vs Immigrants from Senegal Female Poverty
COMPARE
Immigrants from Czechoslovakia
Immigrants from Senegal
Female Poverty
Female Poverty Comparison
Immigrants from Czechoslovakia
Immigrants from Senegal
11.9%
FEMALE POVERTY
99.2/ 100
METRIC RATING
45th/ 347
METRIC RANK
16.5%
FEMALE POVERTY
0.0/ 100
METRIC RATING
296th/ 347
METRIC RANK
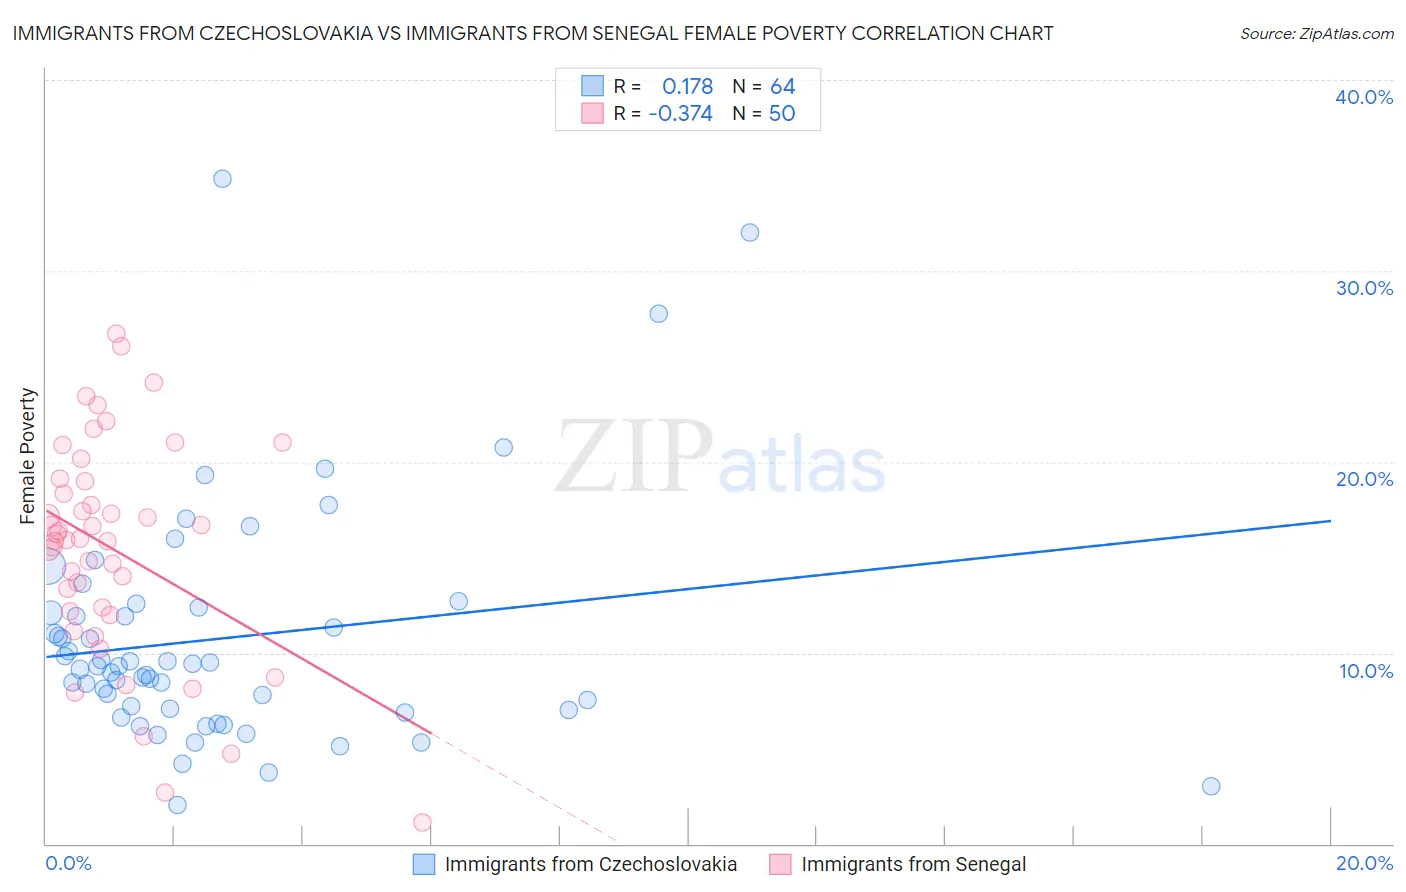
Immigrants from Czechoslovakia vs Immigrants from Senegal Female Poverty Correlation Chart
The statistical analysis conducted on geographies consisting of 195,448,057 people shows a poor positive correlation between the proportion of Immigrants from Czechoslovakia and poverty level among females in the United States with a correlation coefficient (R) of 0.178 and weighted average of 11.9%. Similarly, the statistical analysis conducted on geographies consisting of 90,102,855 people shows a mild negative correlation between the proportion of Immigrants from Senegal and poverty level among females in the United States with a correlation coefficient (R) of -0.374 and weighted average of 16.5%, a difference of 38.3%.
Female Poverty Correlation Summary
| Measurement | Immigrants from Czechoslovakia | Immigrants from Senegal |
| Minimum | 2.0% | 1.1% |
| Maximum | 34.9% | 26.7% |
| Range | 32.8% | 25.6% |
| Mean | 10.7% | 15.4% |
| Median | 9.3% | 16.0% |
| Interquartile 25% (IQ1) | 7.0% | 12.2% |
| Interquartile 75% (IQ3) | 12.2% | 19.0% |
| Interquartile Range (IQR) | 5.2% | 6.8% |
| Standard Deviation (Sample) | 6.2% | 5.7% |
| Standard Deviation (Population) | 6.1% | 5.6% |
Similar Demographics by Female Poverty
Demographics Similar to Immigrants from Czechoslovakia by Female Poverty
In terms of female poverty, the demographic groups most similar to Immigrants from Czechoslovakia are Turkish (11.9%, a difference of 0.0%), Tongan (11.9%, a difference of 0.090%), Korean (11.9%, a difference of 0.16%), Czech (11.9%, a difference of 0.20%), and Immigrants from Moldova (11.9%, a difference of 0.20%).
| Demographics | Rating | Rank | Female Poverty |
| Russians | 99.3 /100 | #38 | Exceptional 11.8% |
| Immigrants | Poland | 99.3 /100 | #39 | Exceptional 11.8% |
| Macedonians | 99.3 /100 | #40 | Exceptional 11.8% |
| Czechs | 99.2 /100 | #41 | Exceptional 11.9% |
| Immigrants | Moldova | 99.2 /100 | #42 | Exceptional 11.9% |
| Koreans | 99.2 /100 | #43 | Exceptional 11.9% |
| Tongans | 99.2 /100 | #44 | Exceptional 11.9% |
| Immigrants | Czechoslovakia | 99.2 /100 | #45 | Exceptional 11.9% |
| Turks | 99.2 /100 | #46 | Exceptional 11.9% |
| Asians | 99.1 /100 | #47 | Exceptional 11.9% |
| Immigrants | Japan | 99.0 /100 | #48 | Exceptional 11.9% |
| Immigrants | Romania | 99.0 /100 | #49 | Exceptional 12.0% |
| Slovenes | 98.9 /100 | #50 | Exceptional 12.0% |
| Immigrants | Bulgaria | 98.9 /100 | #51 | Exceptional 12.0% |
| Immigrants | Croatia | 98.7 /100 | #52 | Exceptional 12.0% |
Demographics Similar to Immigrants from Senegal by Female Poverty
In terms of female poverty, the demographic groups most similar to Immigrants from Senegal are Senegalese (16.5%, a difference of 0.020%), Immigrants from Cabo Verde (16.4%, a difference of 0.10%), Immigrants from Latin America (16.4%, a difference of 0.13%), Immigrants from Zaire (16.4%, a difference of 0.19%), and Yaqui (16.4%, a difference of 0.20%).
| Demographics | Rating | Rank | Female Poverty |
| Blackfeet | 0.0 /100 | #289 | Tragic 16.4% |
| Immigrants | Bangladesh | 0.0 /100 | #290 | Tragic 16.4% |
| Yaqui | 0.0 /100 | #291 | Tragic 16.4% |
| Immigrants | Zaire | 0.0 /100 | #292 | Tragic 16.4% |
| Immigrants | Latin America | 0.0 /100 | #293 | Tragic 16.4% |
| Immigrants | Cabo Verde | 0.0 /100 | #294 | Tragic 16.4% |
| Senegalese | 0.0 /100 | #295 | Tragic 16.5% |
| Immigrants | Senegal | 0.0 /100 | #296 | Tragic 16.5% |
| Mexicans | 0.0 /100 | #297 | Tragic 16.5% |
| Somalis | 0.0 /100 | #298 | Tragic 16.6% |
| Hispanics or Latinos | 0.0 /100 | #299 | Tragic 16.6% |
| Bahamians | 0.0 /100 | #300 | Tragic 16.6% |
| Guatemalans | 0.0 /100 | #301 | Tragic 16.7% |
| Chippewa | 0.0 /100 | #302 | Tragic 16.7% |
| Choctaw | 0.0 /100 | #303 | Tragic 16.8% |