Immigrants from Czechoslovakia vs Immigrants from Senegal Disability Age 35 to 64
COMPARE
Immigrants from Czechoslovakia
Immigrants from Senegal
Disability Age 35 to 64
Disability Age 35 to 64 Comparison
Immigrants from Czechoslovakia
Immigrants from Senegal
10.0%
DISABILITY AGE 35 TO 64
99.7/ 100
METRIC RATING
63rd/ 347
METRIC RANK
12.2%
DISABILITY AGE 35 TO 64
1.3/ 100
METRIC RATING
247th/ 347
METRIC RANK
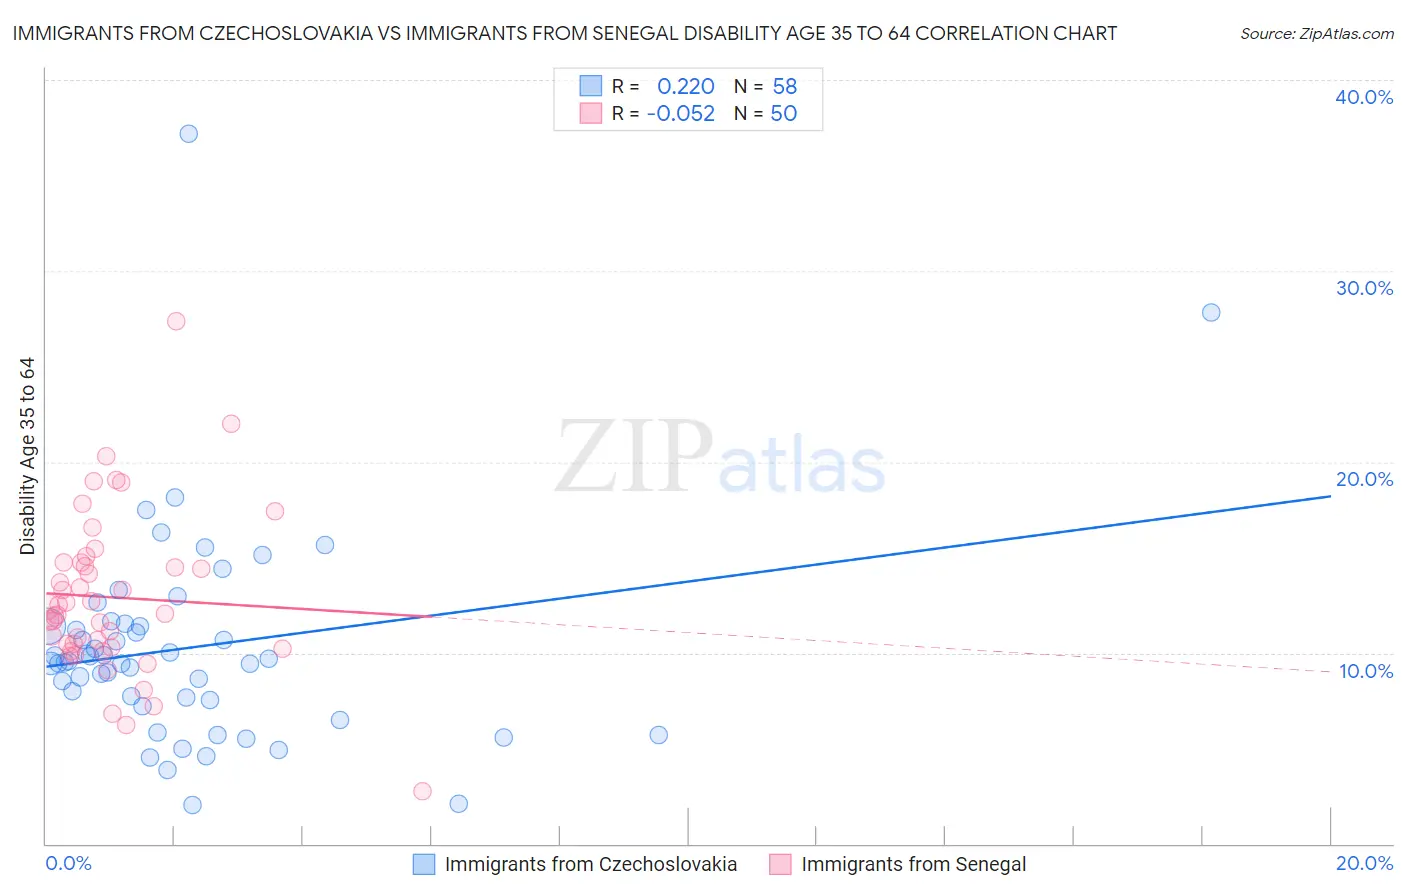
Immigrants from Czechoslovakia vs Immigrants from Senegal Disability Age 35 to 64 Correlation Chart
The statistical analysis conducted on geographies consisting of 195,428,118 people shows a weak positive correlation between the proportion of Immigrants from Czechoslovakia and percentage of population with a disability between the ages 34 and 64 in the United States with a correlation coefficient (R) of 0.220 and weighted average of 10.0%. Similarly, the statistical analysis conducted on geographies consisting of 90,123,819 people shows a slight negative correlation between the proportion of Immigrants from Senegal and percentage of population with a disability between the ages 34 and 64 in the United States with a correlation coefficient (R) of -0.052 and weighted average of 12.2%, a difference of 22.8%.
Disability Age 35 to 64 Correlation Summary
| Measurement | Immigrants from Czechoslovakia | Immigrants from Senegal |
| Minimum | 2.1% | 2.8% |
| Maximum | 37.2% | 27.4% |
| Range | 35.1% | 24.6% |
| Mean | 10.3% | 12.9% |
| Median | 9.5% | 12.2% |
| Interquartile 25% (IQ1) | 7.5% | 10.2% |
| Interquartile 75% (IQ3) | 11.4% | 14.7% |
| Interquartile Range (IQR) | 3.9% | 4.5% |
| Standard Deviation (Sample) | 5.6% | 4.3% |
| Standard Deviation (Population) | 5.5% | 4.2% |
Similar Demographics by Disability Age 35 to 64
Demographics Similar to Immigrants from Czechoslovakia by Disability Age 35 to 64
In terms of disability age 35 to 64, the demographic groups most similar to Immigrants from Czechoslovakia are Eastern European (10.0%, a difference of 0.12%), Immigrants from Romania (10.0%, a difference of 0.20%), Immigrants from Spain (10.0%, a difference of 0.22%), Immigrants from Poland (10.0%, a difference of 0.27%), and Immigrants from South America (9.9%, a difference of 0.34%).
| Demographics | Rating | Rank | Disability Age 35 to 64 |
| South Americans | 99.8 /100 | #56 | Exceptional 9.9% |
| Colombians | 99.8 /100 | #57 | Exceptional 9.9% |
| Armenians | 99.8 /100 | #58 | Exceptional 9.9% |
| Immigrants | Sweden | 99.7 /100 | #59 | Exceptional 9.9% |
| Immigrants | South America | 99.7 /100 | #60 | Exceptional 9.9% |
| Immigrants | Spain | 99.7 /100 | #61 | Exceptional 10.0% |
| Eastern Europeans | 99.7 /100 | #62 | Exceptional 10.0% |
| Immigrants | Czechoslovakia | 99.7 /100 | #63 | Exceptional 10.0% |
| Immigrants | Romania | 99.7 /100 | #64 | Exceptional 10.0% |
| Immigrants | Poland | 99.6 /100 | #65 | Exceptional 10.0% |
| Cubans | 99.6 /100 | #66 | Exceptional 10.0% |
| Immigrants | Uzbekistan | 99.5 /100 | #67 | Exceptional 10.1% |
| Immigrants | Switzerland | 99.5 /100 | #68 | Exceptional 10.1% |
| Immigrants | Eastern Europe | 99.5 /100 | #69 | Exceptional 10.1% |
| Immigrants | Nicaragua | 99.5 /100 | #70 | Exceptional 10.1% |
Demographics Similar to Immigrants from Senegal by Disability Age 35 to 64
In terms of disability age 35 to 64, the demographic groups most similar to Immigrants from Senegal are Guamanian/Chamorro (12.2%, a difference of 0.040%), Spaniard (12.3%, a difference of 0.10%), Hispanic or Latino (12.3%, a difference of 0.12%), Immigrants from Burma/Myanmar (12.3%, a difference of 0.26%), and German (12.3%, a difference of 0.33%).
| Demographics | Rating | Rank | Disability Age 35 to 64 |
| Immigrants | Thailand | 3.3 /100 | #240 | Tragic 12.0% |
| Mexican American Indians | 3.2 /100 | #241 | Tragic 12.0% |
| Samoans | 2.8 /100 | #242 | Tragic 12.1% |
| Slovaks | 2.7 /100 | #243 | Tragic 12.1% |
| Finns | 2.3 /100 | #244 | Tragic 12.1% |
| Immigrants | Mexico | 2.2 /100 | #245 | Tragic 12.1% |
| Guamanians/Chamorros | 1.4 /100 | #246 | Tragic 12.2% |
| Immigrants | Senegal | 1.3 /100 | #247 | Tragic 12.2% |
| Spaniards | 1.3 /100 | #248 | Tragic 12.3% |
| Hispanics or Latinos | 1.3 /100 | #249 | Tragic 12.3% |
| Immigrants | Burma/Myanmar | 1.2 /100 | #250 | Tragic 12.3% |
| Germans | 1.1 /100 | #251 | Tragic 12.3% |
| Irish | 1.0 /100 | #252 | Tragic 12.3% |
| Dutch | 1.0 /100 | #253 | Tragic 12.3% |
| Hawaiians | 0.9 /100 | #254 | Tragic 12.3% |