Immigrants from Cuba vs Scotch-Irish Single Male Poverty
COMPARE
Immigrants from Cuba
Scotch-Irish
Single Male Poverty
Single Male Poverty Comparison
Immigrants from Cuba
Scotch-Irish
12.2%
SINGLE MALE POVERTY
97.3/ 100
METRIC RATING
99th/ 347
METRIC RANK
14.7%
SINGLE MALE POVERTY
0.0/ 100
METRIC RATING
295th/ 347
METRIC RANK
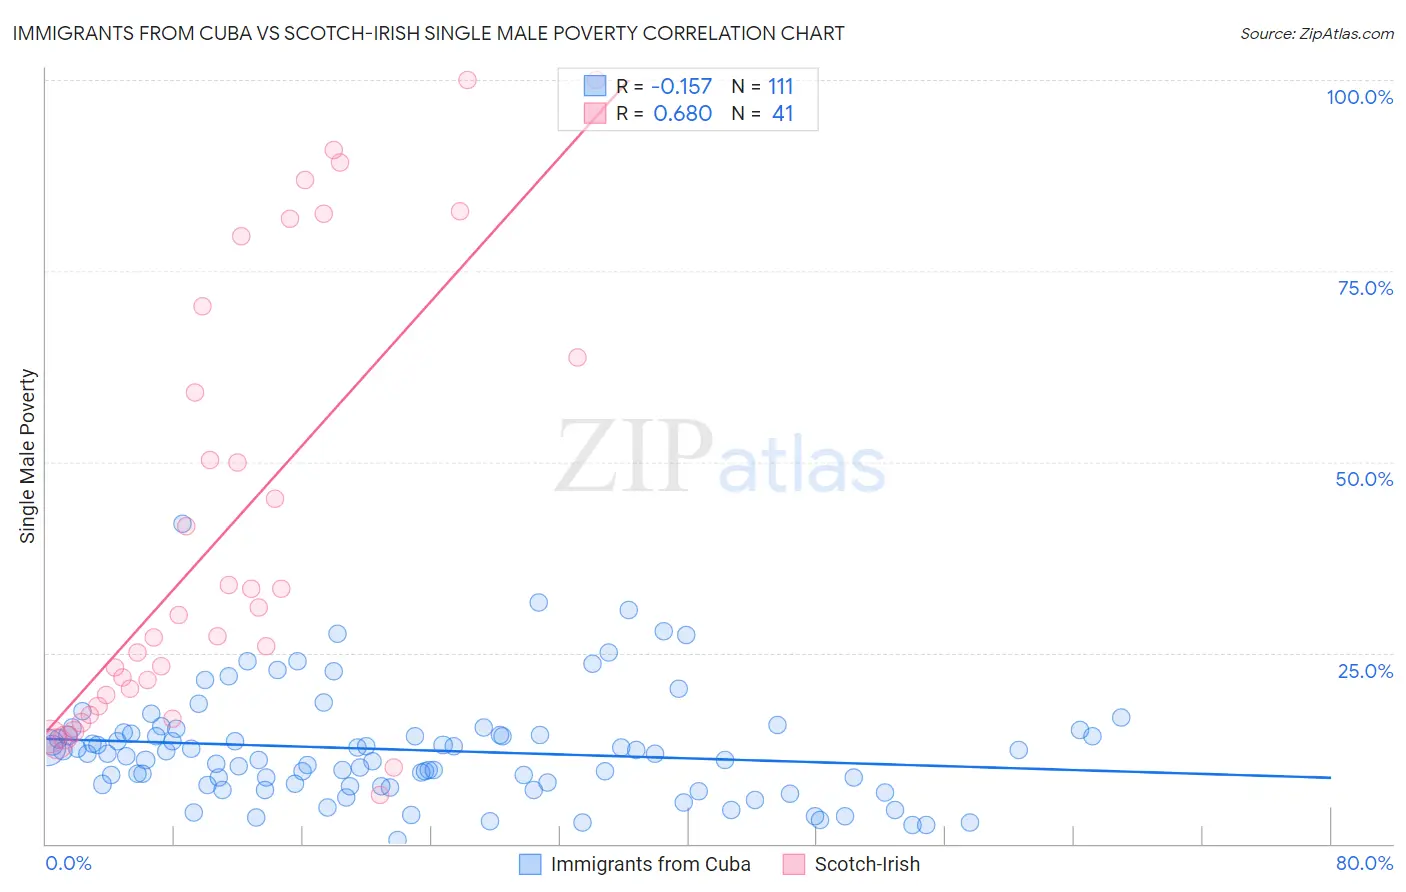
Immigrants from Cuba vs Scotch-Irish Single Male Poverty Correlation Chart
The statistical analysis conducted on geographies consisting of 295,328,231 people shows a poor negative correlation between the proportion of Immigrants from Cuba and poverty level among single males in the United States with a correlation coefficient (R) of -0.157 and weighted average of 12.2%. Similarly, the statistical analysis conducted on geographies consisting of 456,240,238 people shows a significant positive correlation between the proportion of Scotch-Irish and poverty level among single males in the United States with a correlation coefficient (R) of 0.680 and weighted average of 14.7%, a difference of 20.4%.
Single Male Poverty Correlation Summary
| Measurement | Immigrants from Cuba | Scotch-Irish |
| Minimum | 0.49% | 6.4% |
| Maximum | 41.8% | 100.0% |
| Range | 41.3% | 93.6% |
| Mean | 12.3% | 41.7% |
| Median | 11.8% | 30.0% |
| Interquartile 25% (IQ1) | 7.7% | 18.7% |
| Interquartile 75% (IQ3) | 14.3% | 67.0% |
| Interquartile Range (IQR) | 6.6% | 48.3% |
| Standard Deviation (Sample) | 7.0% | 28.9% |
| Standard Deviation (Population) | 7.0% | 28.5% |
Similar Demographics by Single Male Poverty
Demographics Similar to Immigrants from Cuba by Single Male Poverty
In terms of single male poverty, the demographic groups most similar to Immigrants from Cuba are Immigrants from Italy (12.2%, a difference of 0.040%), Guamanian/Chamorro (12.2%, a difference of 0.040%), Immigrants from Sweden (12.2%, a difference of 0.090%), Immigrants from Australia (12.2%, a difference of 0.11%), and Immigrants from Latvia (12.2%, a difference of 0.15%).
| Demographics | Rating | Rank | Single Male Poverty |
| Spanish American Indians | 98.0 /100 | #92 | Exceptional 12.1% |
| Immigrants | Bosnia and Herzegovina | 97.9 /100 | #93 | Exceptional 12.1% |
| Colombians | 97.8 /100 | #94 | Exceptional 12.2% |
| Mongolians | 97.7 /100 | #95 | Exceptional 12.2% |
| Immigrants | Sweden | 97.5 /100 | #96 | Exceptional 12.2% |
| Immigrants | Italy | 97.4 /100 | #97 | Exceptional 12.2% |
| Guamanians/Chamorros | 97.4 /100 | #98 | Exceptional 12.2% |
| Immigrants | Cuba | 97.3 /100 | #99 | Exceptional 12.2% |
| Immigrants | Australia | 97.1 /100 | #100 | Exceptional 12.2% |
| Immigrants | Latvia | 97.0 /100 | #101 | Exceptional 12.2% |
| Immigrants | Europe | 97.0 /100 | #102 | Exceptional 12.2% |
| Immigrants | Armenia | 96.7 /100 | #103 | Exceptional 12.2% |
| Immigrants | Kazakhstan | 96.7 /100 | #104 | Exceptional 12.2% |
| Jordanians | 95.9 /100 | #105 | Exceptional 12.3% |
| Immigrants | Morocco | 95.6 /100 | #106 | Exceptional 12.3% |
Demographics Similar to Scotch-Irish by Single Male Poverty
In terms of single male poverty, the demographic groups most similar to Scotch-Irish are African (14.7%, a difference of 0.33%), Ottawa (14.6%, a difference of 0.44%), French Canadian (14.6%, a difference of 0.63%), Immigrants from Dominican Republic (14.8%, a difference of 0.67%), and Nonimmigrants (14.6%, a difference of 0.74%).
| Demographics | Rating | Rank | Single Male Poverty |
| Whites/Caucasians | 0.0 /100 | #288 | Tragic 14.5% |
| Immigrants | Dominica | 0.0 /100 | #289 | Tragic 14.5% |
| U.S. Virgin Islanders | 0.0 /100 | #290 | Tragic 14.5% |
| Bahamians | 0.0 /100 | #291 | Tragic 14.6% |
| Immigrants | Nonimmigrants | 0.0 /100 | #292 | Tragic 14.6% |
| French Canadians | 0.0 /100 | #293 | Tragic 14.6% |
| Ottawa | 0.0 /100 | #294 | Tragic 14.6% |
| Scotch-Irish | 0.0 /100 | #295 | Tragic 14.7% |
| Africans | 0.0 /100 | #296 | Tragic 14.7% |
| Immigrants | Dominican Republic | 0.0 /100 | #297 | Tragic 14.8% |
| French American Indians | 0.0 /100 | #298 | Tragic 15.0% |
| Delaware | 0.0 /100 | #299 | Tragic 15.0% |
| Cree | 0.0 /100 | #300 | Tragic 15.1% |
| Dominicans | 0.0 /100 | #301 | Tragic 15.2% |
| Alsatians | 0.0 /100 | #302 | Tragic 15.2% |