Immigrants from Cuba vs Northern European Single Male Poverty
COMPARE
Immigrants from Cuba
Northern European
Single Male Poverty
Single Male Poverty Comparison
Immigrants from Cuba
Northern Europeans
12.2%
SINGLE MALE POVERTY
97.3/ 100
METRIC RATING
99th/ 347
METRIC RANK
13.0%
SINGLE MALE POVERTY
18.9/ 100
METRIC RATING
206th/ 347
METRIC RANK
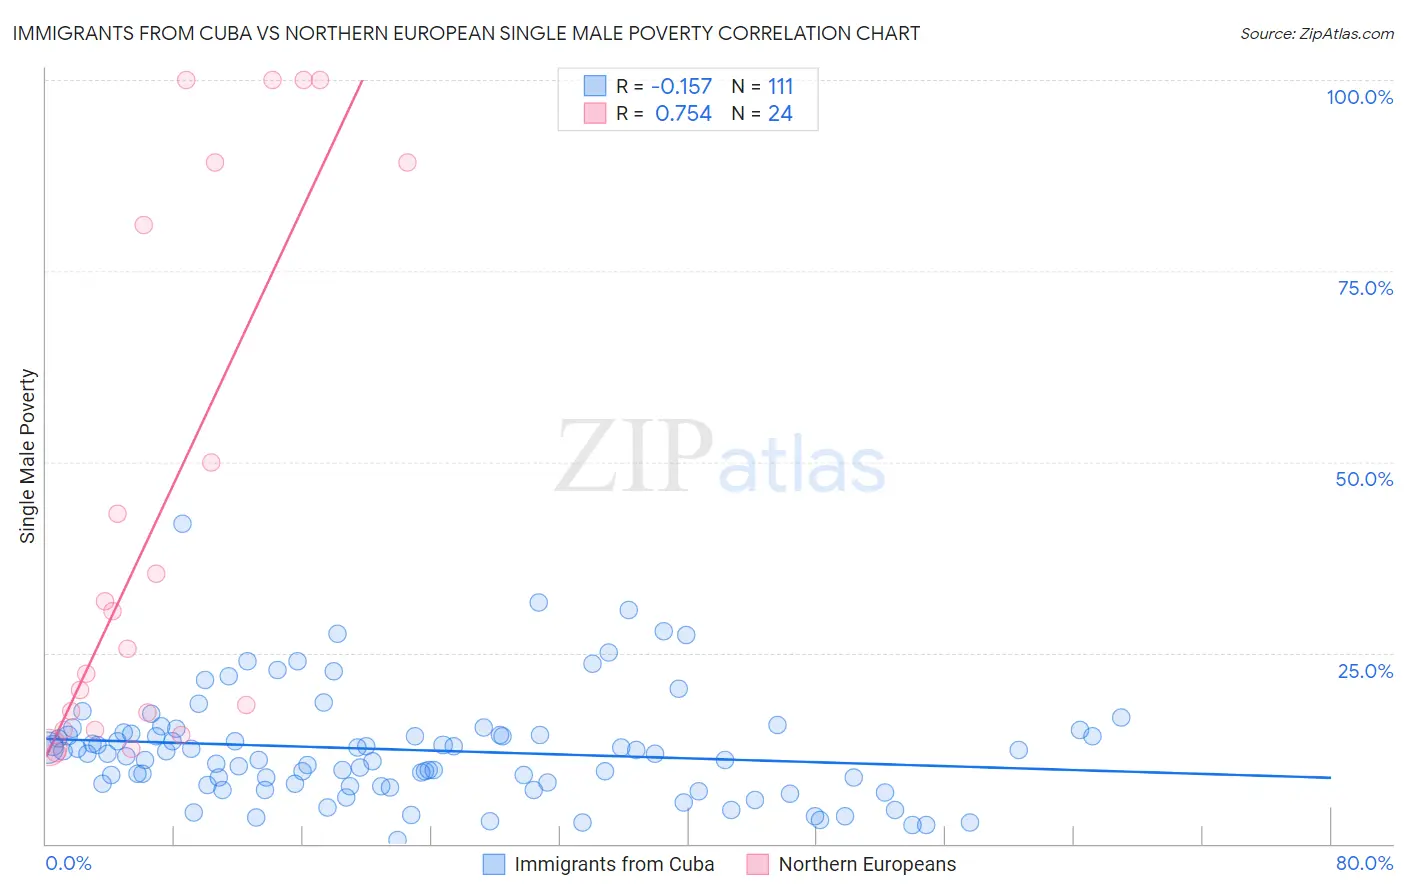
Immigrants from Cuba vs Northern European Single Male Poverty Correlation Chart
The statistical analysis conducted on geographies consisting of 295,328,231 people shows a poor negative correlation between the proportion of Immigrants from Cuba and poverty level among single males in the United States with a correlation coefficient (R) of -0.157 and weighted average of 12.2%. Similarly, the statistical analysis conducted on geographies consisting of 353,212,567 people shows a strong positive correlation between the proportion of Northern Europeans and poverty level among single males in the United States with a correlation coefficient (R) of 0.754 and weighted average of 13.0%, a difference of 7.0%.
Single Male Poverty Correlation Summary
| Measurement | Immigrants from Cuba | Northern European |
| Minimum | 0.49% | 12.0% |
| Maximum | 41.8% | 100.0% |
| Range | 41.3% | 88.0% |
| Mean | 12.3% | 43.8% |
| Median | 11.8% | 28.0% |
| Interquartile 25% (IQ1) | 7.7% | 16.1% |
| Interquartile 75% (IQ3) | 14.3% | 85.1% |
| Interquartile Range (IQR) | 6.6% | 69.0% |
| Standard Deviation (Sample) | 7.0% | 34.6% |
| Standard Deviation (Population) | 7.0% | 33.9% |
Similar Demographics by Single Male Poverty
Demographics Similar to Immigrants from Cuba by Single Male Poverty
In terms of single male poverty, the demographic groups most similar to Immigrants from Cuba are Immigrants from Italy (12.2%, a difference of 0.040%), Guamanian/Chamorro (12.2%, a difference of 0.040%), Immigrants from Sweden (12.2%, a difference of 0.090%), Immigrants from Australia (12.2%, a difference of 0.11%), and Immigrants from Latvia (12.2%, a difference of 0.15%).
| Demographics | Rating | Rank | Single Male Poverty |
| Spanish American Indians | 98.0 /100 | #92 | Exceptional 12.1% |
| Immigrants | Bosnia and Herzegovina | 97.9 /100 | #93 | Exceptional 12.1% |
| Colombians | 97.8 /100 | #94 | Exceptional 12.2% |
| Mongolians | 97.7 /100 | #95 | Exceptional 12.2% |
| Immigrants | Sweden | 97.5 /100 | #96 | Exceptional 12.2% |
| Immigrants | Italy | 97.4 /100 | #97 | Exceptional 12.2% |
| Guamanians/Chamorros | 97.4 /100 | #98 | Exceptional 12.2% |
| Immigrants | Cuba | 97.3 /100 | #99 | Exceptional 12.2% |
| Immigrants | Australia | 97.1 /100 | #100 | Exceptional 12.2% |
| Immigrants | Latvia | 97.0 /100 | #101 | Exceptional 12.2% |
| Immigrants | Europe | 97.0 /100 | #102 | Exceptional 12.2% |
| Immigrants | Armenia | 96.7 /100 | #103 | Exceptional 12.2% |
| Immigrants | Kazakhstan | 96.7 /100 | #104 | Exceptional 12.2% |
| Jordanians | 95.9 /100 | #105 | Exceptional 12.3% |
| Immigrants | Morocco | 95.6 /100 | #106 | Exceptional 12.3% |
Demographics Similar to Northern Europeans by Single Male Poverty
In terms of single male poverty, the demographic groups most similar to Northern Europeans are Polish (13.0%, a difference of 0.040%), Sudanese (13.1%, a difference of 0.10%), Immigrants from Western Africa (13.1%, a difference of 0.11%), Immigrants from Bangladesh (13.0%, a difference of 0.12%), and Estonian (13.0%, a difference of 0.12%).
| Demographics | Rating | Rank | Single Male Poverty |
| Immigrants | Norway | 21.8 /100 | #199 | Fair 13.0% |
| Slovenes | 21.6 /100 | #200 | Fair 13.0% |
| Trinidadians and Tobagonians | 21.4 /100 | #201 | Fair 13.0% |
| Basques | 20.7 /100 | #202 | Fair 13.0% |
| Immigrants | Bangladesh | 20.4 /100 | #203 | Fair 13.0% |
| Estonians | 20.3 /100 | #204 | Fair 13.0% |
| Poles | 19.3 /100 | #205 | Poor 13.0% |
| Northern Europeans | 18.9 /100 | #206 | Poor 13.0% |
| Sudanese | 17.7 /100 | #207 | Poor 13.1% |
| Immigrants | Western Africa | 17.6 /100 | #208 | Poor 13.1% |
| Mexican American Indians | 17.5 /100 | #209 | Poor 13.1% |
| Immigrants | Haiti | 16.8 /100 | #210 | Poor 13.1% |
| Swedes | 16.8 /100 | #211 | Poor 13.1% |
| Senegalese | 16.4 /100 | #212 | Poor 13.1% |
| Italians | 15.9 /100 | #213 | Poor 13.1% |