Immigrants from Cuba vs Scotch-Irish Unemployment Among Women with Children Under 18 years
COMPARE
Immigrants from Cuba
Scotch-Irish
Unemployment Among Women with Children Under 18 years
Unemployment Among Women with Children Under 18 years Comparison
Immigrants from Cuba
Scotch-Irish
5.2%
UNEMPLOYMENT AMONG WOMEN WITH CHILDREN UNDER 18 YEARS
90.9/ 100
METRIC RATING
102nd/ 347
METRIC RANK
5.3%
UNEMPLOYMENT AMONG WOMEN WITH CHILDREN UNDER 18 YEARS
85.7/ 100
METRIC RATING
122nd/ 347
METRIC RANK
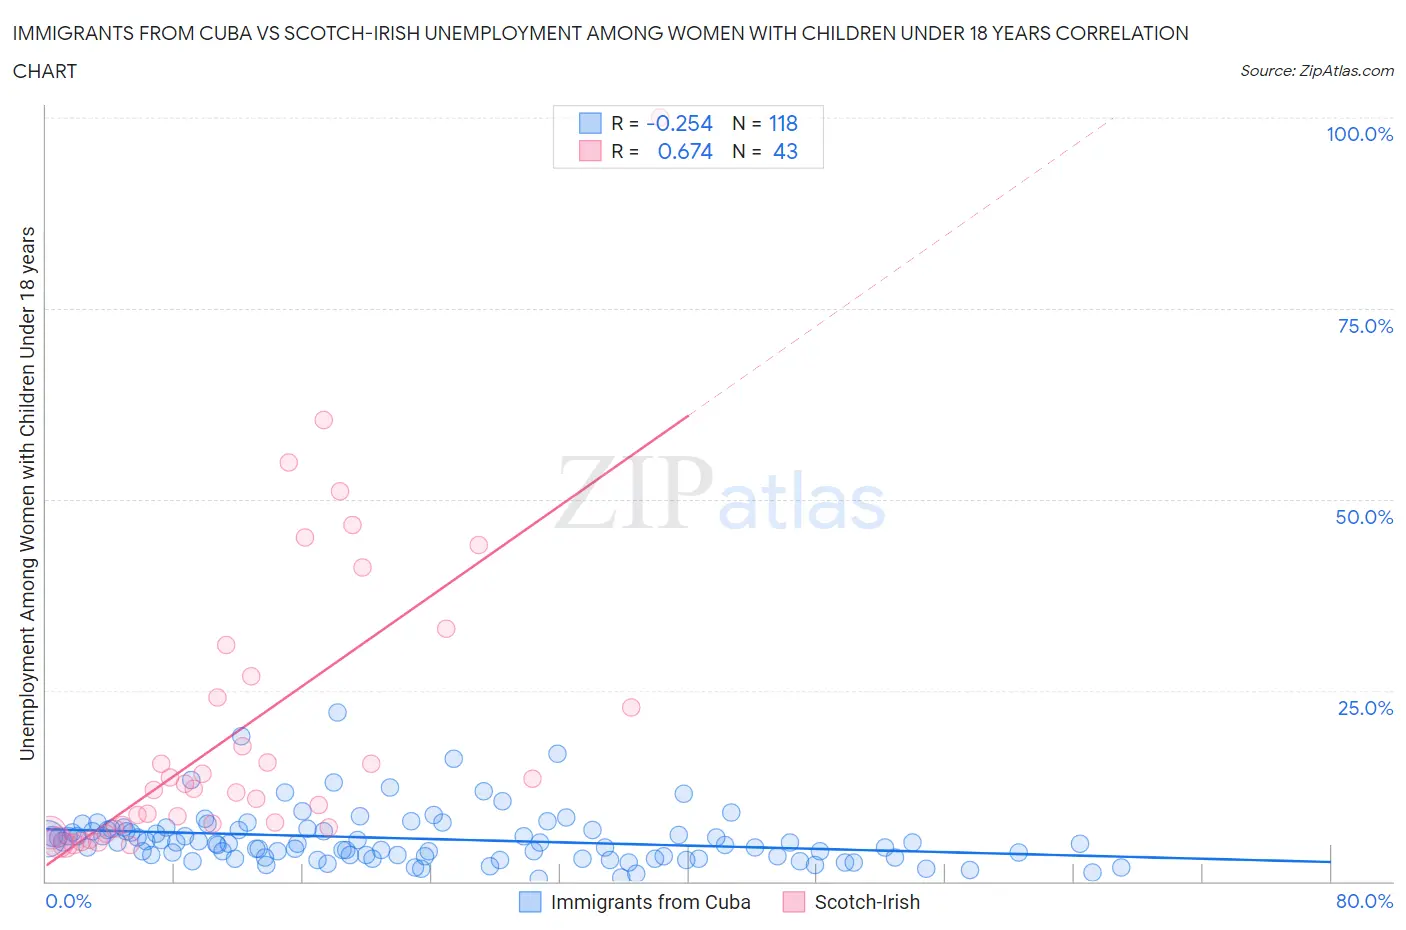
Immigrants from Cuba vs Scotch-Irish Unemployment Among Women with Children Under 18 years Correlation Chart
The statistical analysis conducted on geographies consisting of 316,364,577 people shows a weak negative correlation between the proportion of Immigrants from Cuba and unemployment rate among women with children under the age of 18 in the United States with a correlation coefficient (R) of -0.254 and weighted average of 5.2%. Similarly, the statistical analysis conducted on geographies consisting of 498,737,336 people shows a significant positive correlation between the proportion of Scotch-Irish and unemployment rate among women with children under the age of 18 in the United States with a correlation coefficient (R) of 0.674 and weighted average of 5.3%, a difference of 0.95%.
Unemployment Among Women with Children Under 18 years Correlation Summary
| Measurement | Immigrants from Cuba | Scotch-Irish |
| Minimum | 0.40% | 4.7% |
| Maximum | 22.0% | 100.0% |
| Range | 21.6% | 95.3% |
| Mean | 5.6% | 20.1% |
| Median | 4.9% | 12.1% |
| Interquartile 25% (IQ1) | 3.2% | 7.0% |
| Interquartile 75% (IQ3) | 6.7% | 26.8% |
| Interquartile Range (IQR) | 3.5% | 19.8% |
| Standard Deviation (Sample) | 3.6% | 19.9% |
| Standard Deviation (Population) | 3.6% | 19.7% |
Demographics Similar to Immigrants from Cuba and Scotch-Irish by Unemployment Among Women with Children Under 18 years
In terms of unemployment among women with children under 18 years, the demographic groups most similar to Immigrants from Cuba are Sri Lankan (5.2%, a difference of 0.15%), Immigrants from Switzerland (5.2%, a difference of 0.18%), Immigrants from France (5.2%, a difference of 0.20%), Pakistani (5.2%, a difference of 0.23%), and Slavic (5.2%, a difference of 0.23%). Similarly, the demographic groups most similar to Scotch-Irish are Immigrants from Romania (5.3%, a difference of 0.010%), Egyptian (5.3%, a difference of 0.11%), Basque (5.3%, a difference of 0.13%), Immigrants from Europe (5.3%, a difference of 0.16%), and Canadian (5.3%, a difference of 0.26%).
| Demographics | Rating | Rank | Unemployment Among Women with Children Under 18 years |
| Immigrants | Cuba | 90.9 /100 | #102 | Exceptional 5.2% |
| Sri Lankans | 90.3 /100 | #103 | Exceptional 5.2% |
| Immigrants | Switzerland | 90.1 /100 | #104 | Exceptional 5.2% |
| Immigrants | France | 90.0 /100 | #105 | Excellent 5.2% |
| Pakistanis | 89.9 /100 | #106 | Excellent 5.2% |
| Slavs | 89.8 /100 | #107 | Excellent 5.2% |
| Iranians | 89.7 /100 | #108 | Excellent 5.2% |
| Immigrants | Russia | 89.0 /100 | #109 | Excellent 5.2% |
| Immigrants | Czechoslovakia | 88.9 /100 | #110 | Excellent 5.2% |
| French Canadians | 88.9 /100 | #111 | Excellent 5.2% |
| Immigrants | Eastern Europe | 88.5 /100 | #112 | Excellent 5.2% |
| French | 88.4 /100 | #113 | Excellent 5.2% |
| Kenyans | 88.2 /100 | #114 | Excellent 5.3% |
| Hungarians | 88.1 /100 | #115 | Excellent 5.3% |
| Macedonians | 87.7 /100 | #116 | Excellent 5.3% |
| Canadians | 87.4 /100 | #117 | Excellent 5.3% |
| Immigrants | Europe | 86.7 /100 | #118 | Excellent 5.3% |
| Basques | 86.5 /100 | #119 | Excellent 5.3% |
| Egyptians | 86.4 /100 | #120 | Excellent 5.3% |
| Immigrants | Romania | 85.8 /100 | #121 | Excellent 5.3% |
| Scotch-Irish | 85.7 /100 | #122 | Excellent 5.3% |