Immigrants from Cuba vs Northern European In Labor Force | Age 20-24
COMPARE
Immigrants from Cuba
Northern European
In Labor Force | Age 20-24
In Labor Force | Age 20-24 Comparison
Immigrants from Cuba
Northern Europeans
72.0%
IN LABOR FORCE | AGE 20-24
0.0/ 100
METRIC RATING
310th/ 347
METRIC RANK
76.8%
IN LABOR FORCE | AGE 20-24
99.8/ 100
METRIC RATING
71st/ 347
METRIC RANK
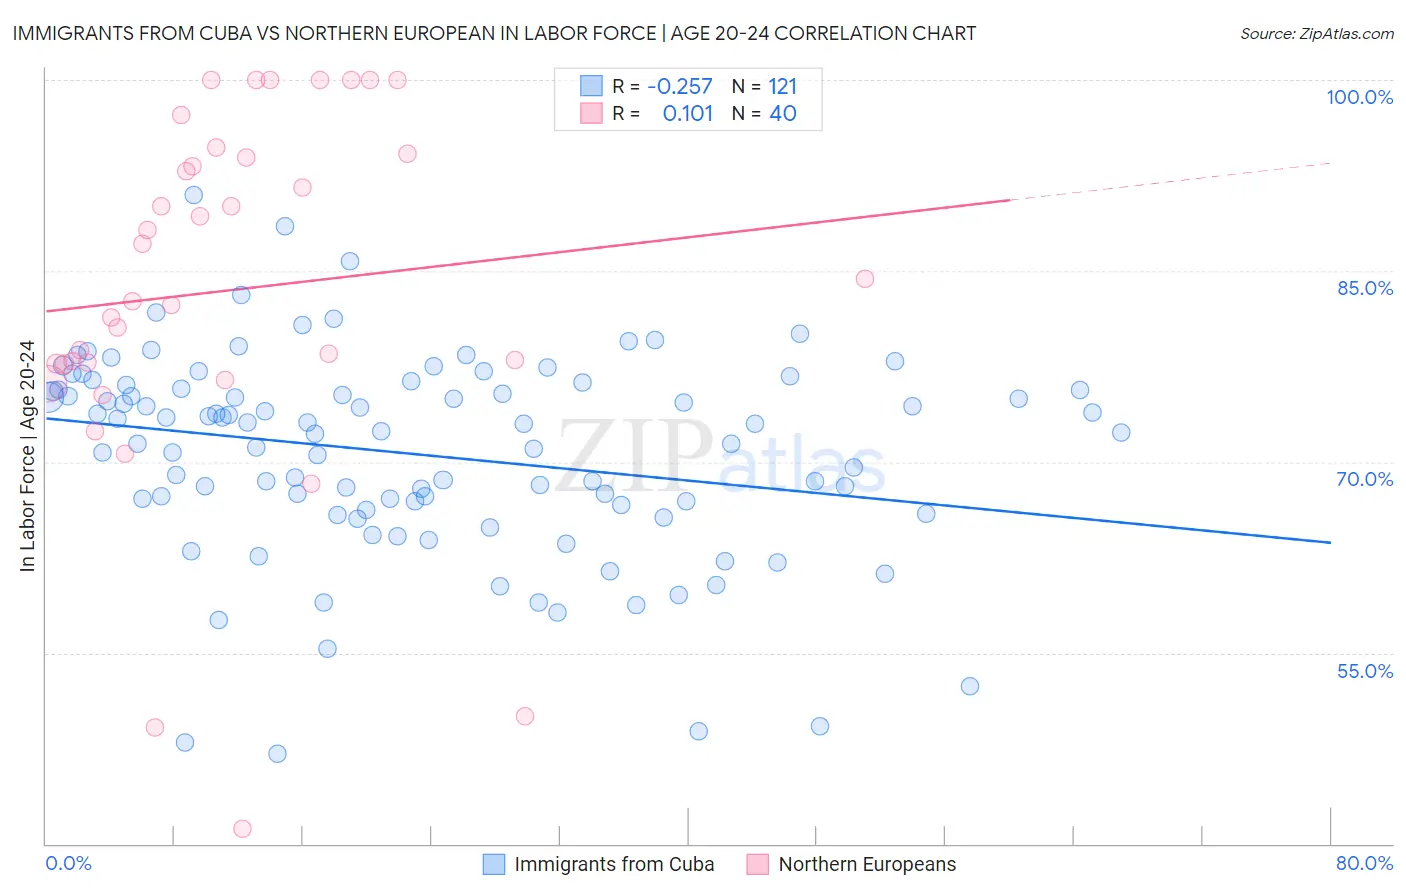
Immigrants from Cuba vs Northern European In Labor Force | Age 20-24 Correlation Chart
The statistical analysis conducted on geographies consisting of 325,873,529 people shows a weak negative correlation between the proportion of Immigrants from Cuba and labor force participation rate among population between the ages 20 and 24 in the United States with a correlation coefficient (R) of -0.257 and weighted average of 72.0%. Similarly, the statistical analysis conducted on geographies consisting of 405,750,071 people shows a poor positive correlation between the proportion of Northern Europeans and labor force participation rate among population between the ages 20 and 24 in the United States with a correlation coefficient (R) of 0.101 and weighted average of 76.8%, a difference of 6.7%.
In Labor Force | Age 20-24 Correlation Summary
| Measurement | Immigrants from Cuba | Northern European |
| Minimum | 47.0% | 41.2% |
| Maximum | 91.0% | 100.0% |
| Range | 43.9% | 58.8% |
| Mean | 70.6% | 83.5% |
| Median | 72.4% | 83.5% |
| Interquartile 25% (IQ1) | 66.4% | 77.7% |
| Interquartile 75% (IQ3) | 75.7% | 94.1% |
| Interquartile Range (IQR) | 9.3% | 16.4% |
| Standard Deviation (Sample) | 8.0% | 14.2% |
| Standard Deviation (Population) | 8.0% | 14.0% |
Similar Demographics by In Labor Force | Age 20-24
Demographics Similar to Immigrants from Cuba by In Labor Force | Age 20-24
In terms of in labor force | age 20-24, the demographic groups most similar to Immigrants from Cuba are Apache (72.0%, a difference of 0.010%), Immigrants from Caribbean (71.9%, a difference of 0.080%), Immigrants from Dominica (71.9%, a difference of 0.13%), Indian (Asian) (71.9%, a difference of 0.14%), and Immigrants from Iran (71.8%, a difference of 0.22%).
| Demographics | Rating | Rank | In Labor Force | Age 20-24 |
| Ecuadorians | 0.0 /100 | #303 | Tragic 72.4% |
| Immigrants | West Indies | 0.0 /100 | #304 | Tragic 72.4% |
| Immigrants | Singapore | 0.0 /100 | #305 | Tragic 72.4% |
| Immigrants | Jamaica | 0.0 /100 | #306 | Tragic 72.4% |
| Immigrants | Ecuador | 0.0 /100 | #307 | Tragic 72.3% |
| Soviet Union | 0.0 /100 | #308 | Tragic 72.3% |
| Tsimshian | 0.0 /100 | #309 | Tragic 72.3% |
| Immigrants | Cuba | 0.0 /100 | #310 | Tragic 72.0% |
| Apache | 0.0 /100 | #311 | Tragic 72.0% |
| Immigrants | Caribbean | 0.0 /100 | #312 | Tragic 71.9% |
| Immigrants | Dominica | 0.0 /100 | #313 | Tragic 71.9% |
| Indians (Asian) | 0.0 /100 | #314 | Tragic 71.9% |
| Immigrants | Iran | 0.0 /100 | #315 | Tragic 71.8% |
| Immigrants | Eastern Asia | 0.0 /100 | #316 | Tragic 71.8% |
| Immigrants | Armenia | 0.0 /100 | #317 | Tragic 71.7% |
Demographics Similar to Northern Europeans by In Labor Force | Age 20-24
In terms of in labor force | age 20-24, the demographic groups most similar to Northern Europeans are Guamanian/Chamorro (76.7%, a difference of 0.030%), Ottawa (76.8%, a difference of 0.070%), Immigrants from Sudan (76.8%, a difference of 0.080%), British (76.7%, a difference of 0.080%), and French American Indian (76.8%, a difference of 0.10%).
| Demographics | Rating | Rank | In Labor Force | Age 20-24 |
| Whites/Caucasians | 99.9 /100 | #64 | Exceptional 76.9% |
| Crow | 99.9 /100 | #65 | Exceptional 76.9% |
| Icelanders | 99.9 /100 | #66 | Exceptional 76.9% |
| Slavs | 99.9 /100 | #67 | Exceptional 76.9% |
| French American Indians | 99.8 /100 | #68 | Exceptional 76.8% |
| Immigrants | Sudan | 99.8 /100 | #69 | Exceptional 76.8% |
| Ottawa | 99.8 /100 | #70 | Exceptional 76.8% |
| Northern Europeans | 99.8 /100 | #71 | Exceptional 76.8% |
| Guamanians/Chamorros | 99.8 /100 | #72 | Exceptional 76.7% |
| British | 99.8 /100 | #73 | Exceptional 76.7% |
| Cree | 99.7 /100 | #74 | Exceptional 76.6% |
| Immigrants | Middle Africa | 99.7 /100 | #75 | Exceptional 76.6% |
| Immigrants | Moldova | 99.6 /100 | #76 | Exceptional 76.6% |
| Immigrants | Cameroon | 99.6 /100 | #77 | Exceptional 76.6% |
| Canadians | 99.6 /100 | #78 | Exceptional 76.6% |