Blackfeet vs Northern European Single Male Poverty
COMPARE
Blackfeet
Northern European
Single Male Poverty
Single Male Poverty Comparison
Blackfeet
Northern Europeans
15.5%
SINGLE MALE POVERTY
0.0/ 100
METRIC RATING
305th/ 347
METRIC RANK
13.0%
SINGLE MALE POVERTY
18.9/ 100
METRIC RATING
206th/ 347
METRIC RANK
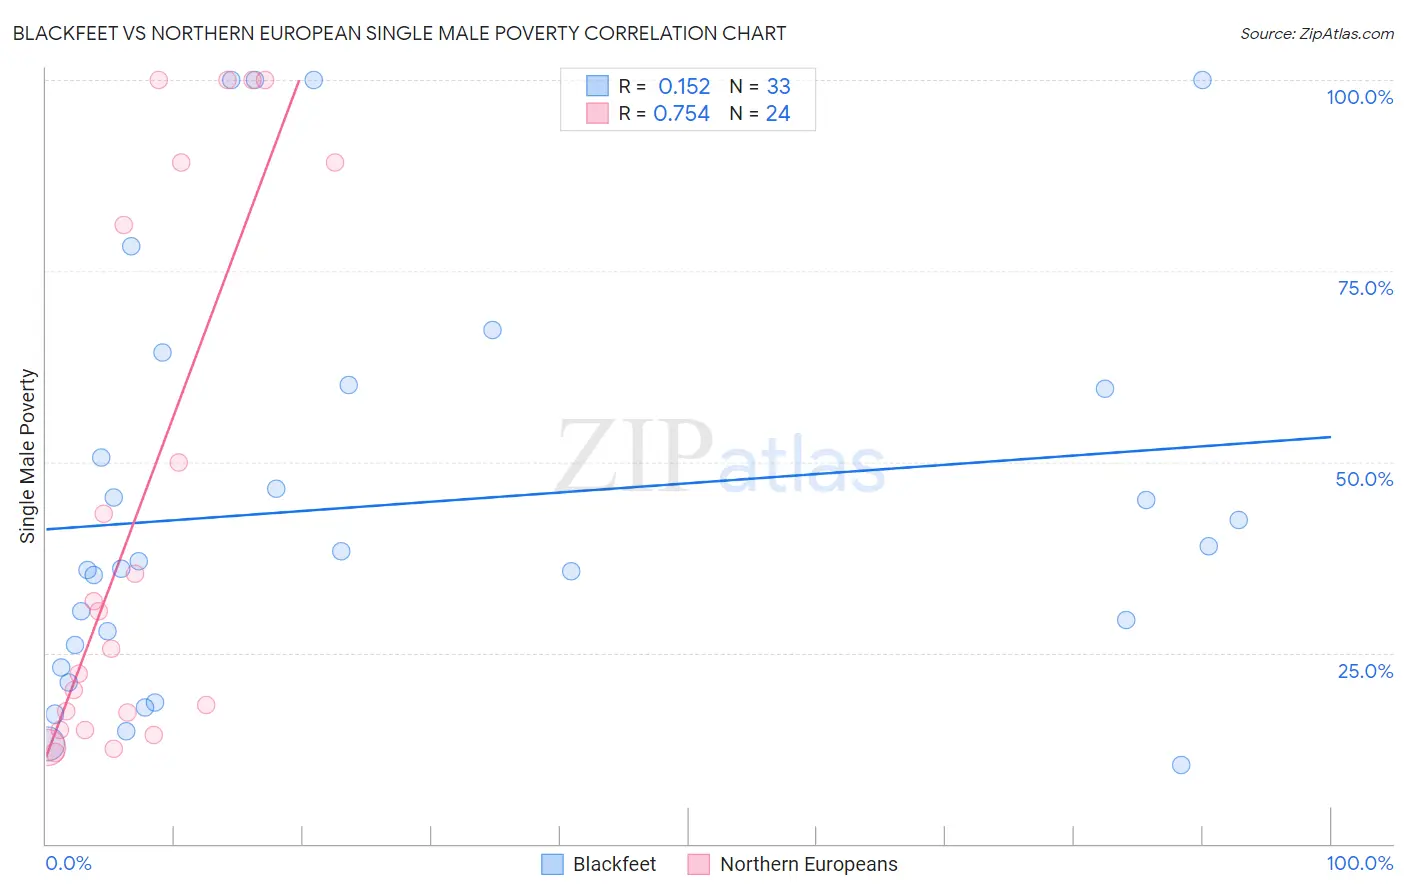
Blackfeet vs Northern European Single Male Poverty Correlation Chart
The statistical analysis conducted on geographies consisting of 285,257,695 people shows a poor positive correlation between the proportion of Blackfeet and poverty level among single males in the United States with a correlation coefficient (R) of 0.152 and weighted average of 15.5%. Similarly, the statistical analysis conducted on geographies consisting of 353,212,567 people shows a strong positive correlation between the proportion of Northern Europeans and poverty level among single males in the United States with a correlation coefficient (R) of 0.754 and weighted average of 13.0%, a difference of 18.8%.
Single Male Poverty Correlation Summary
| Measurement | Blackfeet | Northern European |
| Minimum | 10.3% | 12.0% |
| Maximum | 100.0% | 100.0% |
| Range | 89.7% | 88.0% |
| Mean | 44.4% | 43.8% |
| Median | 37.0% | 28.0% |
| Interquartile 25% (IQ1) | 24.6% | 16.1% |
| Interquartile 75% (IQ3) | 59.8% | 85.1% |
| Interquartile Range (IQR) | 35.2% | 69.0% |
| Standard Deviation (Sample) | 26.6% | 34.6% |
| Standard Deviation (Population) | 26.1% | 33.9% |
Similar Demographics by Single Male Poverty
Demographics Similar to Blackfeet by Single Male Poverty
In terms of single male poverty, the demographic groups most similar to Blackfeet are Pennsylvania German (15.6%, a difference of 0.43%), Alaska Native (15.4%, a difference of 0.53%), Aleut (15.4%, a difference of 0.64%), Ute (15.7%, a difference of 1.2%), and Alsatian (15.2%, a difference of 1.7%).
| Demographics | Rating | Rank | Single Male Poverty |
| French American Indians | 0.0 /100 | #298 | Tragic 15.0% |
| Delaware | 0.0 /100 | #299 | Tragic 15.0% |
| Cree | 0.0 /100 | #300 | Tragic 15.1% |
| Dominicans | 0.0 /100 | #301 | Tragic 15.2% |
| Alsatians | 0.0 /100 | #302 | Tragic 15.2% |
| Aleuts | 0.0 /100 | #303 | Tragic 15.4% |
| Alaska Natives | 0.0 /100 | #304 | Tragic 15.4% |
| Blackfeet | 0.0 /100 | #305 | Tragic 15.5% |
| Pennsylvania Germans | 0.0 /100 | #306 | Tragic 15.6% |
| Ute | 0.0 /100 | #307 | Tragic 15.7% |
| Potawatomi | 0.0 /100 | #308 | Tragic 15.8% |
| Americans | 0.0 /100 | #309 | Tragic 15.8% |
| Yakama | 0.0 /100 | #310 | Tragic 15.9% |
| Seminole | 0.0 /100 | #311 | Tragic 16.0% |
| Comanche | 0.0 /100 | #312 | Tragic 16.0% |
Demographics Similar to Northern Europeans by Single Male Poverty
In terms of single male poverty, the demographic groups most similar to Northern Europeans are Polish (13.0%, a difference of 0.040%), Sudanese (13.1%, a difference of 0.10%), Immigrants from Western Africa (13.1%, a difference of 0.11%), Immigrants from Bangladesh (13.0%, a difference of 0.12%), and Estonian (13.0%, a difference of 0.12%).
| Demographics | Rating | Rank | Single Male Poverty |
| Immigrants | Norway | 21.8 /100 | #199 | Fair 13.0% |
| Slovenes | 21.6 /100 | #200 | Fair 13.0% |
| Trinidadians and Tobagonians | 21.4 /100 | #201 | Fair 13.0% |
| Basques | 20.7 /100 | #202 | Fair 13.0% |
| Immigrants | Bangladesh | 20.4 /100 | #203 | Fair 13.0% |
| Estonians | 20.3 /100 | #204 | Fair 13.0% |
| Poles | 19.3 /100 | #205 | Poor 13.0% |
| Northern Europeans | 18.9 /100 | #206 | Poor 13.0% |
| Sudanese | 17.7 /100 | #207 | Poor 13.1% |
| Immigrants | Western Africa | 17.6 /100 | #208 | Poor 13.1% |
| Mexican American Indians | 17.5 /100 | #209 | Poor 13.1% |
| Immigrants | Haiti | 16.8 /100 | #210 | Poor 13.1% |
| Swedes | 16.8 /100 | #211 | Poor 13.1% |
| Senegalese | 16.4 /100 | #212 | Poor 13.1% |
| Italians | 15.9 /100 | #213 | Poor 13.1% |