Peruvian vs Northern European Single Male Poverty
COMPARE
Peruvian
Northern European
Single Male Poverty
Single Male Poverty Comparison
Peruvians
Northern Europeans
11.8%
SINGLE MALE POVERTY
99.8/ 100
METRIC RATING
60th/ 347
METRIC RANK
13.0%
SINGLE MALE POVERTY
18.9/ 100
METRIC RATING
206th/ 347
METRIC RANK
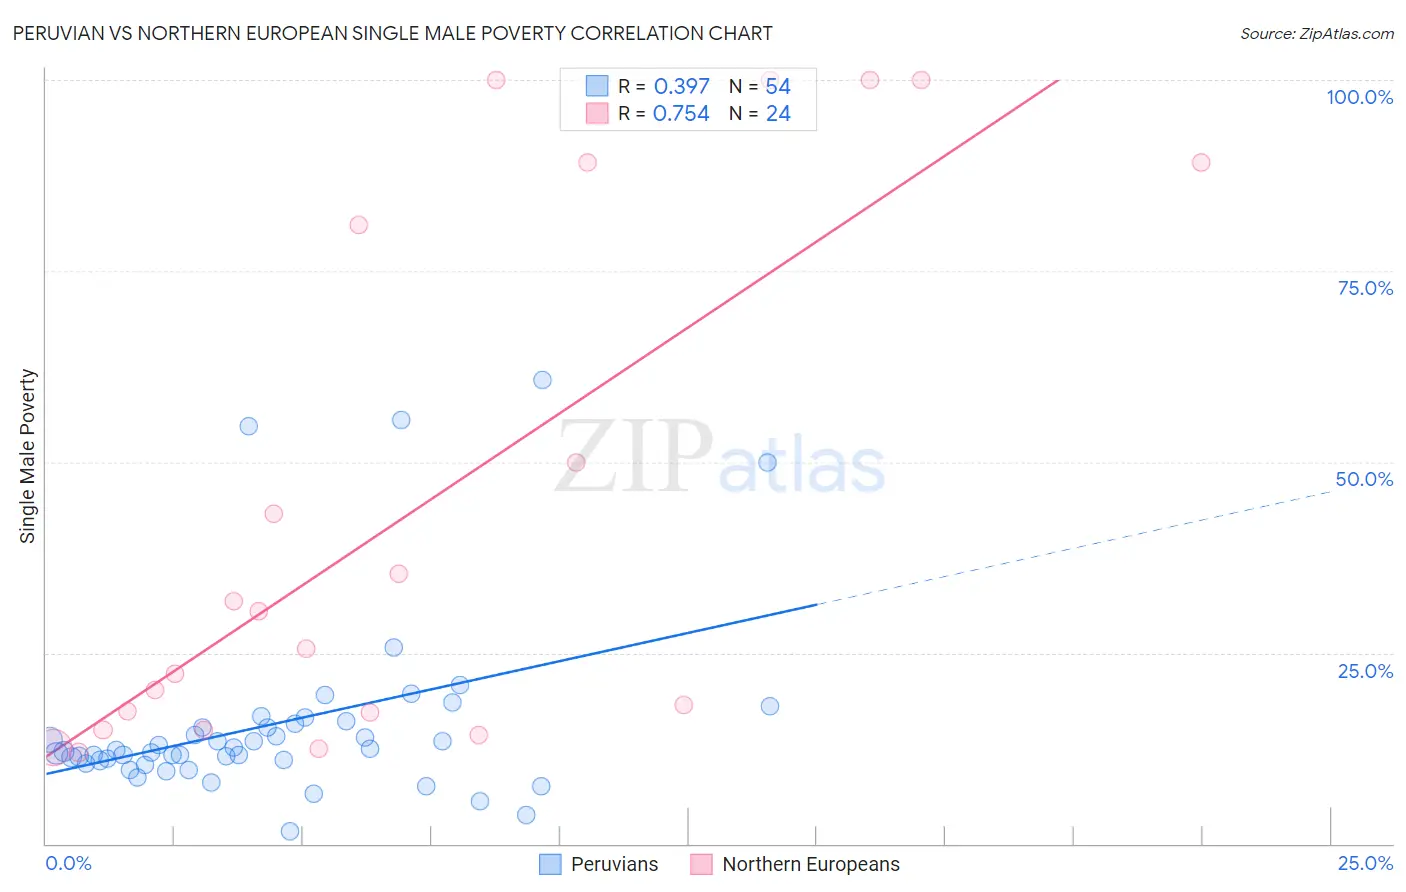
Peruvian vs Northern European Single Male Poverty Correlation Chart
The statistical analysis conducted on geographies consisting of 326,481,306 people shows a mild positive correlation between the proportion of Peruvians and poverty level among single males in the United States with a correlation coefficient (R) of 0.397 and weighted average of 11.8%. Similarly, the statistical analysis conducted on geographies consisting of 353,212,567 people shows a strong positive correlation between the proportion of Northern Europeans and poverty level among single males in the United States with a correlation coefficient (R) of 0.754 and weighted average of 13.0%, a difference of 10.7%.
Single Male Poverty Correlation Summary
| Measurement | Peruvian | Northern European |
| Minimum | 1.7% | 12.0% |
| Maximum | 60.7% | 100.0% |
| Range | 59.0% | 88.0% |
| Mean | 15.6% | 43.8% |
| Median | 12.1% | 28.0% |
| Interquartile 25% (IQ1) | 10.9% | 16.1% |
| Interquartile 75% (IQ3) | 15.7% | 85.1% |
| Interquartile Range (IQR) | 4.8% | 69.0% |
| Standard Deviation (Sample) | 12.1% | 34.6% |
| Standard Deviation (Population) | 12.0% | 33.9% |
Similar Demographics by Single Male Poverty
Demographics Similar to Peruvians by Single Male Poverty
In terms of single male poverty, the demographic groups most similar to Peruvians are Cambodian (11.8%, a difference of 0.020%), Brazilian (11.8%, a difference of 0.21%), Immigrants from Brazil (11.7%, a difference of 0.29%), Immigrants from Romania (11.7%, a difference of 0.32%), and Immigrants from Sri Lanka (11.8%, a difference of 0.40%).
| Demographics | Rating | Rank | Single Male Poverty |
| Bulgarians | 99.9 /100 | #53 | Exceptional 11.7% |
| Immigrants | Uzbekistan | 99.9 /100 | #54 | Exceptional 11.7% |
| Cypriots | 99.9 /100 | #55 | Exceptional 11.7% |
| Burmese | 99.8 /100 | #56 | Exceptional 11.7% |
| Immigrants | Romania | 99.8 /100 | #57 | Exceptional 11.7% |
| Immigrants | Brazil | 99.8 /100 | #58 | Exceptional 11.7% |
| Brazilians | 99.8 /100 | #59 | Exceptional 11.8% |
| Peruvians | 99.8 /100 | #60 | Exceptional 11.8% |
| Cambodians | 99.8 /100 | #61 | Exceptional 11.8% |
| Immigrants | Sri Lanka | 99.7 /100 | #62 | Exceptional 11.8% |
| Immigrants | Belarus | 99.7 /100 | #63 | Exceptional 11.8% |
| Immigrants | Eastern Europe | 99.6 /100 | #64 | Exceptional 11.8% |
| Laotians | 99.6 /100 | #65 | Exceptional 11.9% |
| Immigrants | Uruguay | 99.6 /100 | #66 | Exceptional 11.9% |
| Immigrants | Ukraine | 99.6 /100 | #67 | Exceptional 11.9% |
Demographics Similar to Northern Europeans by Single Male Poverty
In terms of single male poverty, the demographic groups most similar to Northern Europeans are Polish (13.0%, a difference of 0.040%), Sudanese (13.1%, a difference of 0.10%), Immigrants from Western Africa (13.1%, a difference of 0.11%), Immigrants from Bangladesh (13.0%, a difference of 0.12%), and Estonian (13.0%, a difference of 0.12%).
| Demographics | Rating | Rank | Single Male Poverty |
| Immigrants | Norway | 21.8 /100 | #199 | Fair 13.0% |
| Slovenes | 21.6 /100 | #200 | Fair 13.0% |
| Trinidadians and Tobagonians | 21.4 /100 | #201 | Fair 13.0% |
| Basques | 20.7 /100 | #202 | Fair 13.0% |
| Immigrants | Bangladesh | 20.4 /100 | #203 | Fair 13.0% |
| Estonians | 20.3 /100 | #204 | Fair 13.0% |
| Poles | 19.3 /100 | #205 | Poor 13.0% |
| Northern Europeans | 18.9 /100 | #206 | Poor 13.0% |
| Sudanese | 17.7 /100 | #207 | Poor 13.1% |
| Immigrants | Western Africa | 17.6 /100 | #208 | Poor 13.1% |
| Mexican American Indians | 17.5 /100 | #209 | Poor 13.1% |
| Immigrants | Haiti | 16.8 /100 | #210 | Poor 13.1% |
| Swedes | 16.8 /100 | #211 | Poor 13.1% |
| Senegalese | 16.4 /100 | #212 | Poor 13.1% |
| Italians | 15.9 /100 | #213 | Poor 13.1% |