German vs Immigrants from Bulgaria Family Poverty
COMPARE
German
Immigrants from Bulgaria
Family Poverty
Family Poverty Comparison
Germans
Immigrants from Bulgaria
7.7%
FAMILY POVERTY
99.0/ 100
METRIC RATING
44th/ 347
METRIC RANK
7.8%
FAMILY POVERTY
98.3/ 100
METRIC RATING
65th/ 347
METRIC RANK
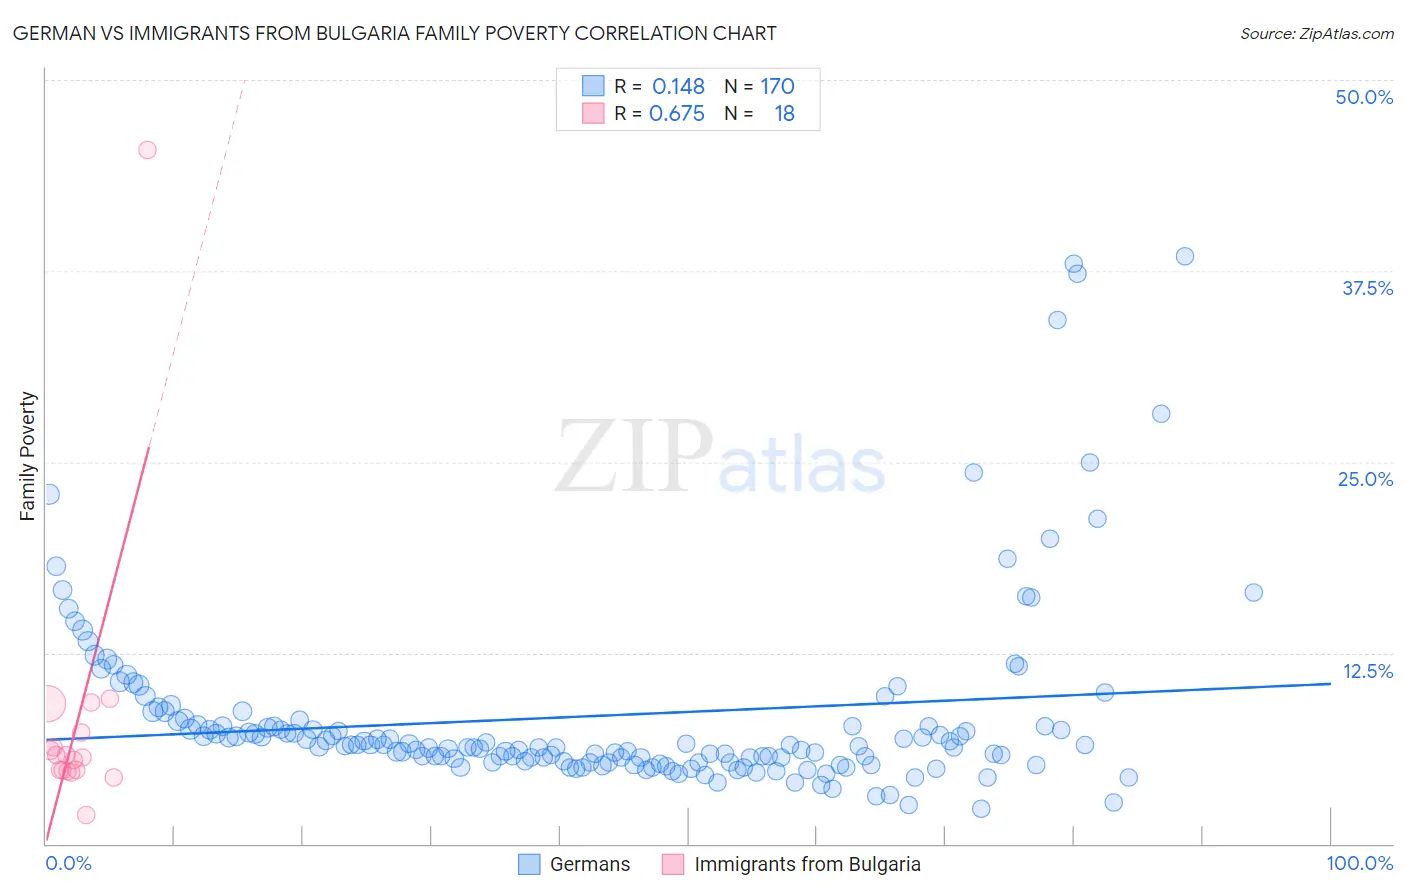
German vs Immigrants from Bulgaria Family Poverty Correlation Chart
The statistical analysis conducted on geographies consisting of 575,144,438 people shows a poor positive correlation between the proportion of Germans and poverty level among families in the United States with a correlation coefficient (R) of 0.148 and weighted average of 7.7%. Similarly, the statistical analysis conducted on geographies consisting of 172,392,882 people shows a significant positive correlation between the proportion of Immigrants from Bulgaria and poverty level among families in the United States with a correlation coefficient (R) of 0.675 and weighted average of 7.8%, a difference of 2.0%.
Family Poverty Correlation Summary
| Measurement | German | Immigrants from Bulgaria |
| Minimum | 2.3% | 1.9% |
| Maximum | 38.5% | 45.5% |
| Range | 36.2% | 43.6% |
| Mean | 8.4% | 8.1% |
| Median | 6.4% | 5.7% |
| Interquartile 25% (IQ1) | 5.4% | 4.8% |
| Interquartile 75% (IQ3) | 7.8% | 7.3% |
| Interquartile Range (IQR) | 2.4% | 2.5% |
| Standard Deviation (Sample) | 6.1% | 9.5% |
| Standard Deviation (Population) | 6.1% | 9.2% |
Similar Demographics by Family Poverty
Demographics Similar to Germans by Family Poverty
In terms of family poverty, the demographic groups most similar to Germans are Okinawan (7.7%, a difference of 0.12%), Tongan (7.7%, a difference of 0.14%), Immigrants from Czechoslovakia (7.7%, a difference of 0.15%), Immigrants from Sri Lanka (7.7%, a difference of 0.17%), and Immigrants from Austria (7.6%, a difference of 0.29%).
| Demographics | Rating | Rank | Family Poverty |
| Estonians | 99.4 /100 | #37 | Exceptional 7.5% |
| Bolivians | 99.3 /100 | #38 | Exceptional 7.5% |
| Carpatho Rusyns | 99.3 /100 | #39 | Exceptional 7.5% |
| Slovenes | 99.3 /100 | #40 | Exceptional 7.5% |
| Immigrants | Australia | 99.2 /100 | #41 | Exceptional 7.6% |
| Scandinavians | 99.1 /100 | #42 | Exceptional 7.6% |
| Immigrants | Austria | 99.1 /100 | #43 | Exceptional 7.6% |
| Germans | 99.0 /100 | #44 | Exceptional 7.7% |
| Okinawans | 98.9 /100 | #45 | Exceptional 7.7% |
| Tongans | 98.9 /100 | #46 | Exceptional 7.7% |
| Immigrants | Czechoslovakia | 98.9 /100 | #47 | Exceptional 7.7% |
| Immigrants | Sri Lanka | 98.9 /100 | #48 | Exceptional 7.7% |
| Immigrants | Bolivia | 98.9 /100 | #49 | Exceptional 7.7% |
| Immigrants | North Macedonia | 98.9 /100 | #50 | Exceptional 7.7% |
| Immigrants | Moldova | 98.8 /100 | #51 | Exceptional 7.7% |
Demographics Similar to Immigrants from Bulgaria by Family Poverty
In terms of family poverty, the demographic groups most similar to Immigrants from Bulgaria are Korean (7.8%, a difference of 0.010%), Dutch (7.8%, a difference of 0.060%), Northern European (7.8%, a difference of 0.070%), Australian (7.8%, a difference of 0.11%), and Immigrants from Belgium (7.8%, a difference of 0.12%).
| Demographics | Rating | Rank | Family Poverty |
| Finns | 98.7 /100 | #58 | Exceptional 7.7% |
| Europeans | 98.7 /100 | #59 | Exceptional 7.7% |
| Immigrants | Greece | 98.7 /100 | #60 | Exceptional 7.7% |
| Immigrants | Netherlands | 98.6 /100 | #61 | Exceptional 7.7% |
| Macedonians | 98.6 /100 | #62 | Exceptional 7.8% |
| Zimbabweans | 98.4 /100 | #63 | Exceptional 7.8% |
| Koreans | 98.3 /100 | #64 | Exceptional 7.8% |
| Immigrants | Bulgaria | 98.3 /100 | #65 | Exceptional 7.8% |
| Dutch | 98.3 /100 | #66 | Exceptional 7.8% |
| Northern Europeans | 98.3 /100 | #67 | Exceptional 7.8% |
| Australians | 98.2 /100 | #68 | Exceptional 7.8% |
| Immigrants | Belgium | 98.2 /100 | #69 | Exceptional 7.8% |
| Immigrants | Canada | 98.2 /100 | #70 | Exceptional 7.8% |
| Cambodians | 98.2 /100 | #71 | Exceptional 7.8% |
| Immigrants | Romania | 98.2 /100 | #72 | Exceptional 7.8% |