Immigrants from Congo vs Immigrants from Ethiopia Single Father Poverty
COMPARE
Immigrants from Congo
Immigrants from Ethiopia
Single Father Poverty
Single Father Poverty Comparison
Immigrants from Congo
Immigrants from Ethiopia
15.4%
SINGLE FATHER POVERTY
99.4/ 100
METRIC RATING
81st/ 347
METRIC RANK
13.4%
SINGLE FATHER POVERTY
100.0/ 100
METRIC RATING
5th/ 347
METRIC RANK
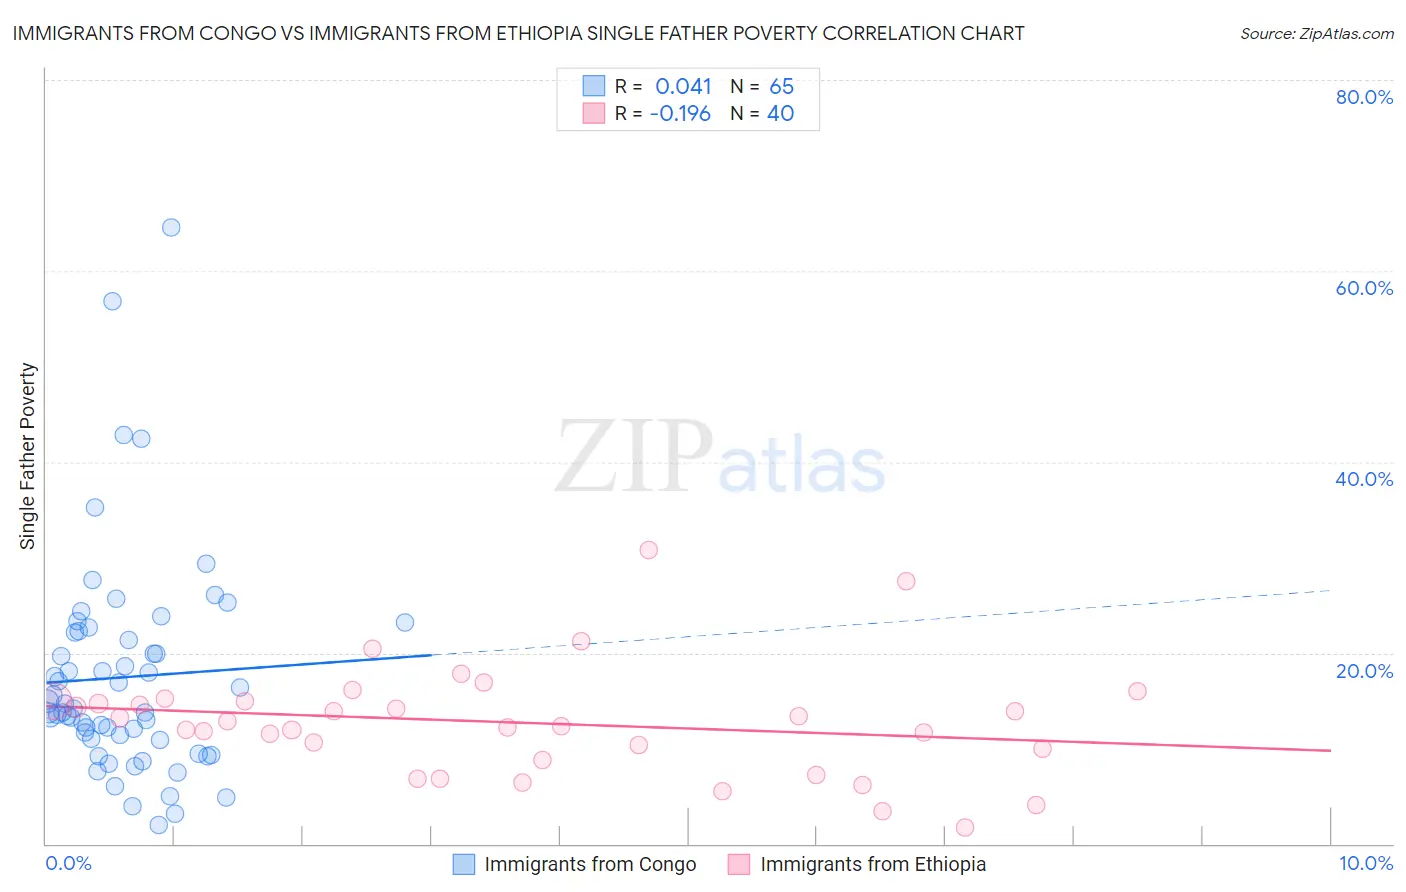
Immigrants from Congo vs Immigrants from Ethiopia Single Father Poverty Correlation Chart
The statistical analysis conducted on geographies consisting of 86,642,680 people shows no correlation between the proportion of Immigrants from Congo and poverty level among single fathers in the United States with a correlation coefficient (R) of 0.041 and weighted average of 15.4%. Similarly, the statistical analysis conducted on geographies consisting of 182,435,040 people shows a poor negative correlation between the proportion of Immigrants from Ethiopia and poverty level among single fathers in the United States with a correlation coefficient (R) of -0.196 and weighted average of 13.4%, a difference of 14.5%.
Single Father Poverty Correlation Summary
| Measurement | Immigrants from Congo | Immigrants from Ethiopia |
| Minimum | 2.0% | 1.7% |
| Maximum | 64.6% | 30.7% |
| Range | 62.6% | 29.0% |
| Mean | 17.4% | 12.7% |
| Median | 14.1% | 12.6% |
| Interquartile 25% (IQ1) | 10.9% | 9.4% |
| Interquartile 75% (IQ3) | 22.2% | 14.9% |
| Interquartile Range (IQR) | 11.2% | 5.5% |
| Standard Deviation (Sample) | 11.4% | 5.8% |
| Standard Deviation (Population) | 11.3% | 5.8% |
Similar Demographics by Single Father Poverty
Demographics Similar to Immigrants from Congo by Single Father Poverty
In terms of single father poverty, the demographic groups most similar to Immigrants from Congo are Immigrants from Ukraine (15.4%, a difference of 0.010%), Armenian (15.4%, a difference of 0.020%), Chinese (15.4%, a difference of 0.10%), Peruvian (15.4%, a difference of 0.24%), and Immigrants from Northern Africa (15.3%, a difference of 0.25%).
| Demographics | Rating | Rank | Single Father Poverty |
| Maltese | 99.6 /100 | #74 | Exceptional 15.3% |
| Immigrants | Turkey | 99.5 /100 | #75 | Exceptional 15.3% |
| Immigrants | Japan | 99.5 /100 | #76 | Exceptional 15.3% |
| Immigrants | Peru | 99.5 /100 | #77 | Exceptional 15.3% |
| Tlingit-Haida | 99.5 /100 | #78 | Exceptional 15.3% |
| Immigrants | Northern Africa | 99.5 /100 | #79 | Exceptional 15.3% |
| Armenians | 99.4 /100 | #80 | Exceptional 15.4% |
| Immigrants | Congo | 99.4 /100 | #81 | Exceptional 15.4% |
| Immigrants | Ukraine | 99.4 /100 | #82 | Exceptional 15.4% |
| Chinese | 99.3 /100 | #83 | Exceptional 15.4% |
| Peruvians | 99.2 /100 | #84 | Exceptional 15.4% |
| Immigrants | Oceania | 99.1 /100 | #85 | Exceptional 15.4% |
| Immigrants | Russia | 99.0 /100 | #86 | Exceptional 15.5% |
| Brazilians | 99.0 /100 | #87 | Exceptional 15.5% |
| Burmese | 99.0 /100 | #88 | Exceptional 15.5% |
Demographics Similar to Immigrants from Ethiopia by Single Father Poverty
In terms of single father poverty, the demographic groups most similar to Immigrants from Ethiopia are Ethiopian (13.5%, a difference of 0.77%), Immigrants from Fiji (13.2%, a difference of 1.6%), Immigrants from Taiwan (13.7%, a difference of 1.8%), Samoan (13.8%, a difference of 2.7%), and Afghan (14.0%, a difference of 3.8%).
| Demographics | Rating | Rank | Single Father Poverty |
| Assyrians/Chaldeans/Syriacs | 100.0 /100 | #1 | Exceptional 11.7% |
| Tongans | 100.0 /100 | #2 | Exceptional 12.2% |
| Tsimshian | 100.0 /100 | #3 | Exceptional 12.7% |
| Immigrants | Fiji | 100.0 /100 | #4 | Exceptional 13.2% |
| Immigrants | Ethiopia | 100.0 /100 | #5 | Exceptional 13.4% |
| Ethiopians | 100.0 /100 | #6 | Exceptional 13.5% |
| Immigrants | Taiwan | 100.0 /100 | #7 | Exceptional 13.7% |
| Samoans | 100.0 /100 | #8 | Exceptional 13.8% |
| Afghans | 100.0 /100 | #9 | Exceptional 14.0% |
| Koreans | 100.0 /100 | #10 | Exceptional 14.0% |
| Filipinos | 100.0 /100 | #11 | Exceptional 14.0% |
| Immigrants | India | 100.0 /100 | #12 | Exceptional 14.0% |
| Immigrants | Philippines | 100.0 /100 | #13 | Exceptional 14.0% |
| Immigrants | Vietnam | 100.0 /100 | #14 | Exceptional 14.1% |
| Sri Lankans | 100.0 /100 | #15 | Exceptional 14.2% |