Immigrants from Congo vs Immigrants from Colombia Single Father Poverty
COMPARE
Immigrants from Congo
Immigrants from Colombia
Single Father Poverty
Single Father Poverty Comparison
Immigrants from Congo
Immigrants from Colombia
15.4%
SINGLE FATHER POVERTY
99.4/ 100
METRIC RATING
81st/ 347
METRIC RANK
15.8%
SINGLE FATHER POVERTY
92.6/ 100
METRIC RATING
117th/ 347
METRIC RANK
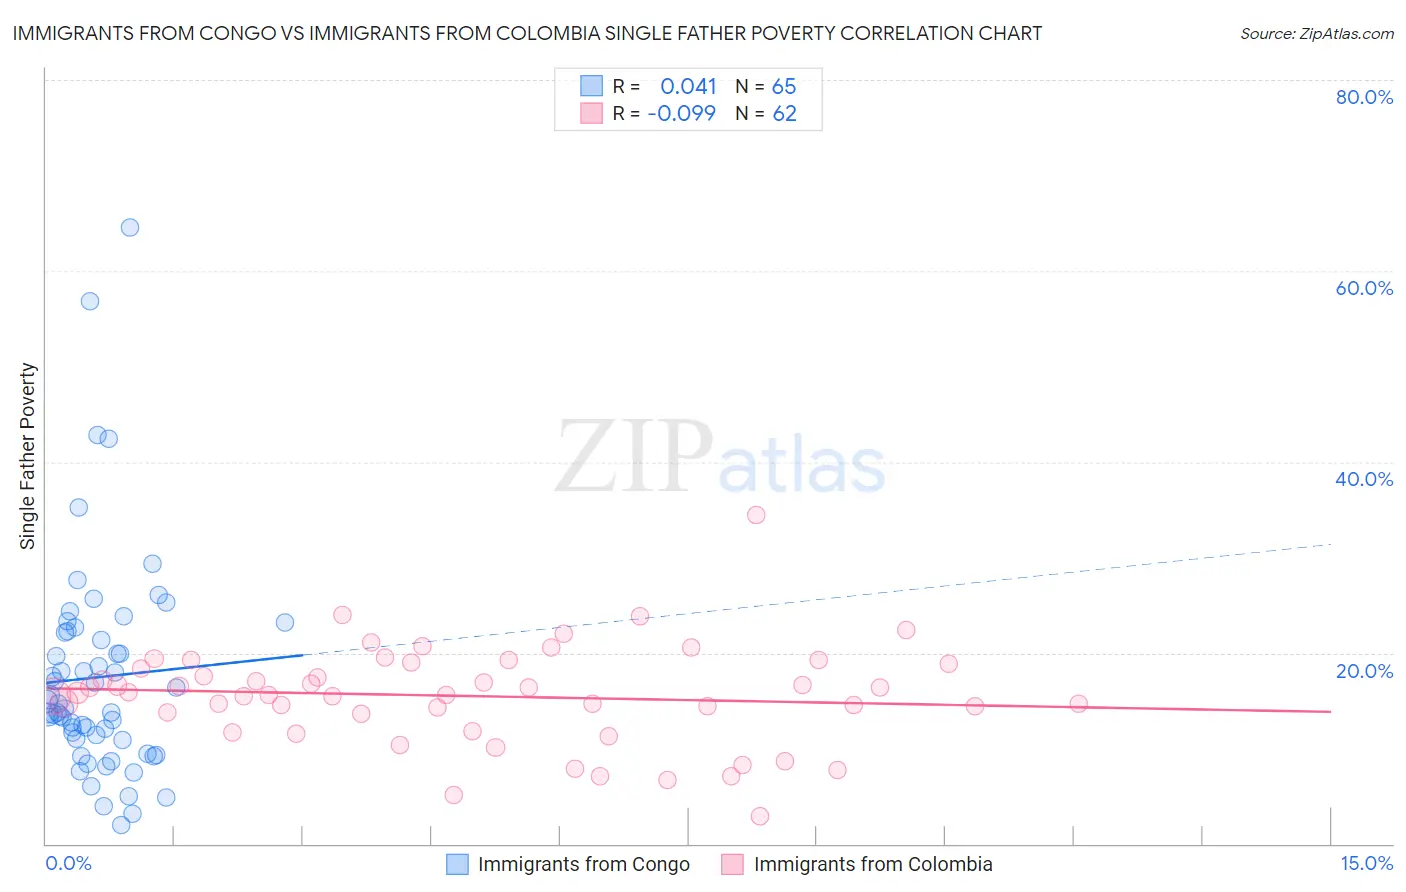
Immigrants from Congo vs Immigrants from Colombia Single Father Poverty Correlation Chart
The statistical analysis conducted on geographies consisting of 86,642,680 people shows no correlation between the proportion of Immigrants from Congo and poverty level among single fathers in the United States with a correlation coefficient (R) of 0.041 and weighted average of 15.4%. Similarly, the statistical analysis conducted on geographies consisting of 300,736,141 people shows a slight negative correlation between the proportion of Immigrants from Colombia and poverty level among single fathers in the United States with a correlation coefficient (R) of -0.099 and weighted average of 15.8%, a difference of 2.9%.
Single Father Poverty Correlation Summary
| Measurement | Immigrants from Congo | Immigrants from Colombia |
| Minimum | 2.0% | 2.9% |
| Maximum | 64.6% | 34.5% |
| Range | 62.6% | 31.5% |
| Mean | 17.4% | 15.5% |
| Median | 14.1% | 15.7% |
| Interquartile 25% (IQ1) | 10.9% | 13.6% |
| Interquartile 75% (IQ3) | 22.2% | 18.9% |
| Interquartile Range (IQR) | 11.2% | 5.3% |
| Standard Deviation (Sample) | 11.4% | 5.2% |
| Standard Deviation (Population) | 11.3% | 5.2% |
Similar Demographics by Single Father Poverty
Demographics Similar to Immigrants from Congo by Single Father Poverty
In terms of single father poverty, the demographic groups most similar to Immigrants from Congo are Immigrants from Ukraine (15.4%, a difference of 0.010%), Armenian (15.4%, a difference of 0.020%), Chinese (15.4%, a difference of 0.10%), Peruvian (15.4%, a difference of 0.24%), and Immigrants from Northern Africa (15.3%, a difference of 0.25%).
| Demographics | Rating | Rank | Single Father Poverty |
| Maltese | 99.6 /100 | #74 | Exceptional 15.3% |
| Immigrants | Turkey | 99.5 /100 | #75 | Exceptional 15.3% |
| Immigrants | Japan | 99.5 /100 | #76 | Exceptional 15.3% |
| Immigrants | Peru | 99.5 /100 | #77 | Exceptional 15.3% |
| Tlingit-Haida | 99.5 /100 | #78 | Exceptional 15.3% |
| Immigrants | Northern Africa | 99.5 /100 | #79 | Exceptional 15.3% |
| Armenians | 99.4 /100 | #80 | Exceptional 15.4% |
| Immigrants | Congo | 99.4 /100 | #81 | Exceptional 15.4% |
| Immigrants | Ukraine | 99.4 /100 | #82 | Exceptional 15.4% |
| Chinese | 99.3 /100 | #83 | Exceptional 15.4% |
| Peruvians | 99.2 /100 | #84 | Exceptional 15.4% |
| Immigrants | Oceania | 99.1 /100 | #85 | Exceptional 15.4% |
| Immigrants | Russia | 99.0 /100 | #86 | Exceptional 15.5% |
| Brazilians | 99.0 /100 | #87 | Exceptional 15.5% |
| Burmese | 99.0 /100 | #88 | Exceptional 15.5% |
Demographics Similar to Immigrants from Colombia by Single Father Poverty
In terms of single father poverty, the demographic groups most similar to Immigrants from Colombia are Immigrants from Eastern Europe (15.8%, a difference of 0.020%), Immigrants from Argentina (15.8%, a difference of 0.030%), Immigrants from Belarus (15.8%, a difference of 0.030%), Uruguayan (15.9%, a difference of 0.090%), and Immigrants (15.9%, a difference of 0.11%).
| Demographics | Rating | Rank | Single Father Poverty |
| Immigrants | Africa | 95.1 /100 | #110 | Exceptional 15.8% |
| Bulgarians | 94.8 /100 | #111 | Exceptional 15.8% |
| Immigrants | Latvia | 94.7 /100 | #112 | Exceptional 15.8% |
| Danes | 94.5 /100 | #113 | Exceptional 15.8% |
| Argentineans | 94.4 /100 | #114 | Exceptional 15.8% |
| Immigrants | Thailand | 93.6 /100 | #115 | Exceptional 15.8% |
| Immigrants | Argentina | 92.8 /100 | #116 | Exceptional 15.8% |
| Immigrants | Colombia | 92.6 /100 | #117 | Exceptional 15.8% |
| Immigrants | Eastern Europe | 92.5 /100 | #118 | Exceptional 15.8% |
| Immigrants | Belarus | 92.4 /100 | #119 | Exceptional 15.8% |
| Uruguayans | 92.1 /100 | #120 | Exceptional 15.9% |
| Immigrants | Immigrants | 91.9 /100 | #121 | Exceptional 15.9% |
| Sudanese | 91.6 /100 | #122 | Exceptional 15.9% |
| Palestinians | 91.3 /100 | #123 | Exceptional 15.9% |
| Immigrants | Panama | 91.3 /100 | #124 | Exceptional 15.9% |