Immigrants from Switzerland vs Belizean Receiving Food Stamps
COMPARE
Immigrants from Switzerland
Belizean
Receiving Food Stamps
Receiving Food Stamps Comparison
Immigrants from Switzerland
Belizeans
9.7%
RECEIVING FOOD STAMPS
99.3/ 100
METRIC RATING
55th/ 347
METRIC RANK
14.8%
RECEIVING FOOD STAMPS
0.1/ 100
METRIC RATING
278th/ 347
METRIC RANK
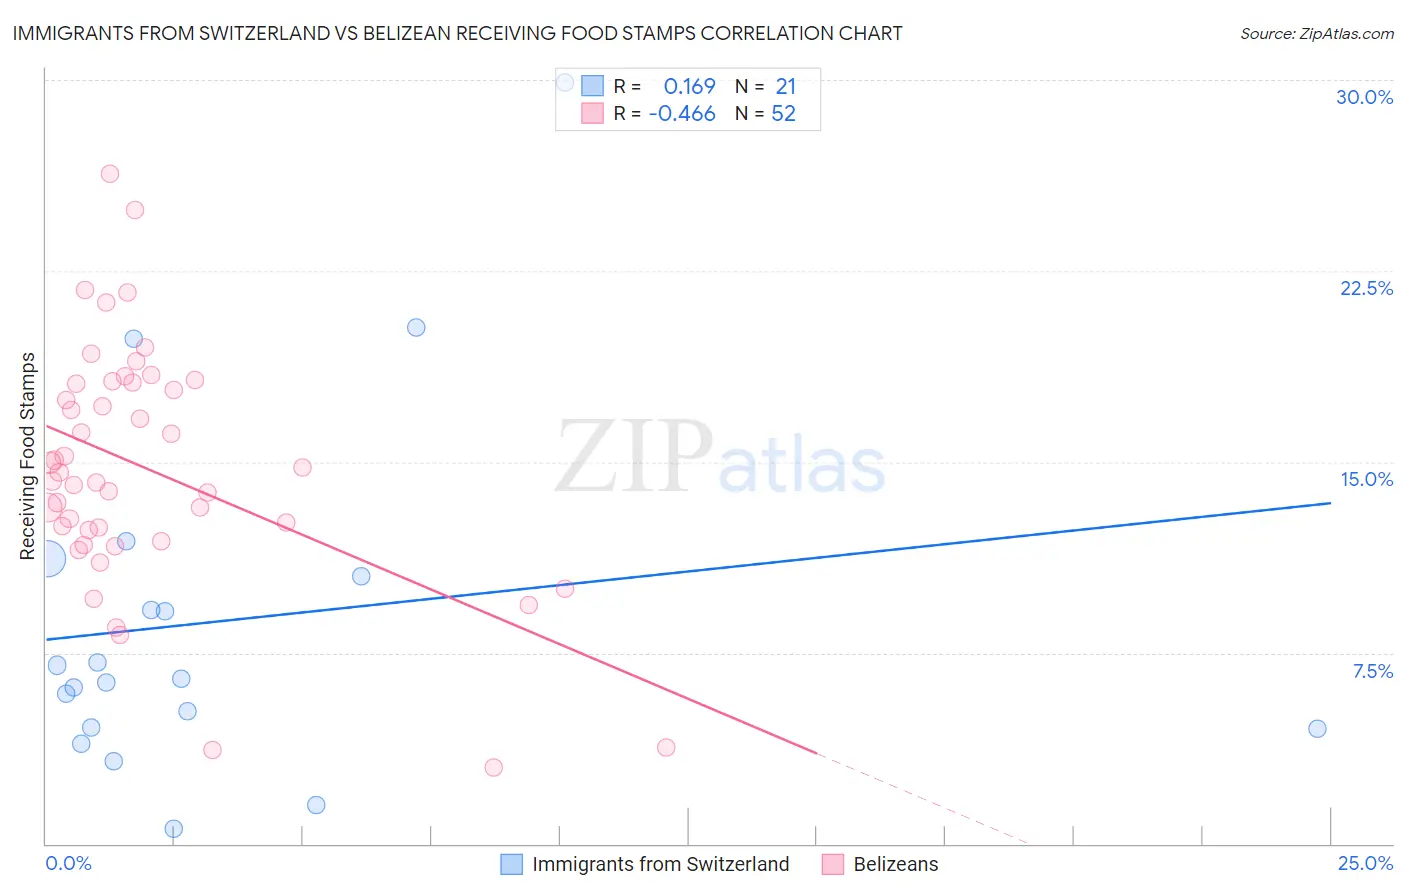
Immigrants from Switzerland vs Belizean Receiving Food Stamps Correlation Chart
The statistical analysis conducted on geographies consisting of 147,876,791 people shows a poor positive correlation between the proportion of Immigrants from Switzerland and percentage of population receiving government assistance and/or food stamps in the United States with a correlation coefficient (R) of 0.169 and weighted average of 9.7%. Similarly, the statistical analysis conducted on geographies consisting of 144,020,862 people shows a moderate negative correlation between the proportion of Belizeans and percentage of population receiving government assistance and/or food stamps in the United States with a correlation coefficient (R) of -0.466 and weighted average of 14.8%, a difference of 52.9%.
Receiving Food Stamps Correlation Summary
| Measurement | Immigrants from Switzerland | Belizean |
| Minimum | 0.61% | 3.0% |
| Maximum | 29.9% | 26.3% |
| Range | 29.3% | 23.3% |
| Mean | 8.8% | 14.7% |
| Median | 6.5% | 14.4% |
| Interquartile 25% (IQ1) | 4.5% | 12.1% |
| Interquartile 75% (IQ3) | 10.9% | 18.1% |
| Interquartile Range (IQR) | 6.3% | 6.0% |
| Standard Deviation (Sample) | 7.0% | 4.8% |
| Standard Deviation (Population) | 6.8% | 4.7% |
Similar Demographics by Receiving Food Stamps
Demographics Similar to Immigrants from Switzerland by Receiving Food Stamps
In terms of receiving food stamps, the demographic groups most similar to Immigrants from Switzerland are Swiss (9.7%, a difference of 0.010%), Tongan (9.7%, a difference of 0.13%), Immigrants from South Africa (9.7%, a difference of 0.14%), Asian (9.7%, a difference of 0.16%), and Immigrants from Canada (9.7%, a difference of 0.18%).
| Demographics | Rating | Rank | Receiving Food Stamps |
| Russians | 99.4 /100 | #48 | Exceptional 9.6% |
| Immigrants | Czechoslovakia | 99.4 /100 | #49 | Exceptional 9.6% |
| Lithuanians | 99.4 /100 | #50 | Exceptional 9.7% |
| Asians | 99.3 /100 | #51 | Exceptional 9.7% |
| Immigrants | South Africa | 99.3 /100 | #52 | Exceptional 9.7% |
| Tongans | 99.3 /100 | #53 | Exceptional 9.7% |
| Swiss | 99.3 /100 | #54 | Exceptional 9.7% |
| Immigrants | Switzerland | 99.3 /100 | #55 | Exceptional 9.7% |
| Immigrants | Canada | 99.3 /100 | #56 | Exceptional 9.7% |
| Greeks | 99.3 /100 | #57 | Exceptional 9.7% |
| Scandinavians | 99.2 /100 | #58 | Exceptional 9.7% |
| British | 99.2 /100 | #59 | Exceptional 9.7% |
| Germans | 99.2 /100 | #60 | Exceptional 9.7% |
| English | 99.2 /100 | #61 | Exceptional 9.8% |
| Immigrants | Bulgaria | 99.2 /100 | #62 | Exceptional 9.8% |
Demographics Similar to Belizeans by Receiving Food Stamps
In terms of receiving food stamps, the demographic groups most similar to Belizeans are Seminole (14.8%, a difference of 0.13%), Liberian (14.8%, a difference of 0.18%), Kiowa (14.9%, a difference of 0.27%), Ecuadorian (14.9%, a difference of 0.32%), and Spanish American Indian (14.9%, a difference of 0.64%).
| Demographics | Rating | Rank | Receiving Food Stamps |
| Immigrants | Guatemala | 0.1 /100 | #271 | Tragic 14.6% |
| Chippewa | 0.1 /100 | #272 | Tragic 14.7% |
| Alaskan Athabascans | 0.1 /100 | #273 | Tragic 14.7% |
| Immigrants | Western Africa | 0.1 /100 | #274 | Tragic 14.7% |
| Ute | 0.1 /100 | #275 | Tragic 14.7% |
| Liberians | 0.1 /100 | #276 | Tragic 14.8% |
| Seminole | 0.1 /100 | #277 | Tragic 14.8% |
| Belizeans | 0.1 /100 | #278 | Tragic 14.8% |
| Kiowa | 0.0 /100 | #279 | Tragic 14.9% |
| Ecuadorians | 0.0 /100 | #280 | Tragic 14.9% |
| Spanish American Indians | 0.0 /100 | #281 | Tragic 14.9% |
| Immigrants | Central America | 0.0 /100 | #282 | Tragic 15.0% |
| Bangladeshis | 0.0 /100 | #283 | Tragic 15.0% |
| Immigrants | Ecuador | 0.0 /100 | #284 | Tragic 15.0% |
| Immigrants | Liberia | 0.0 /100 | #285 | Tragic 15.1% |