Immigrants from Senegal vs Belizean Receiving Food Stamps
COMPARE
Immigrants from Senegal
Belizean
Receiving Food Stamps
Receiving Food Stamps Comparison
Immigrants from Senegal
Belizeans
15.3%
RECEIVING FOOD STAMPS
0.0/ 100
METRIC RATING
289th/ 347
METRIC RANK
14.8%
RECEIVING FOOD STAMPS
0.1/ 100
METRIC RATING
278th/ 347
METRIC RANK
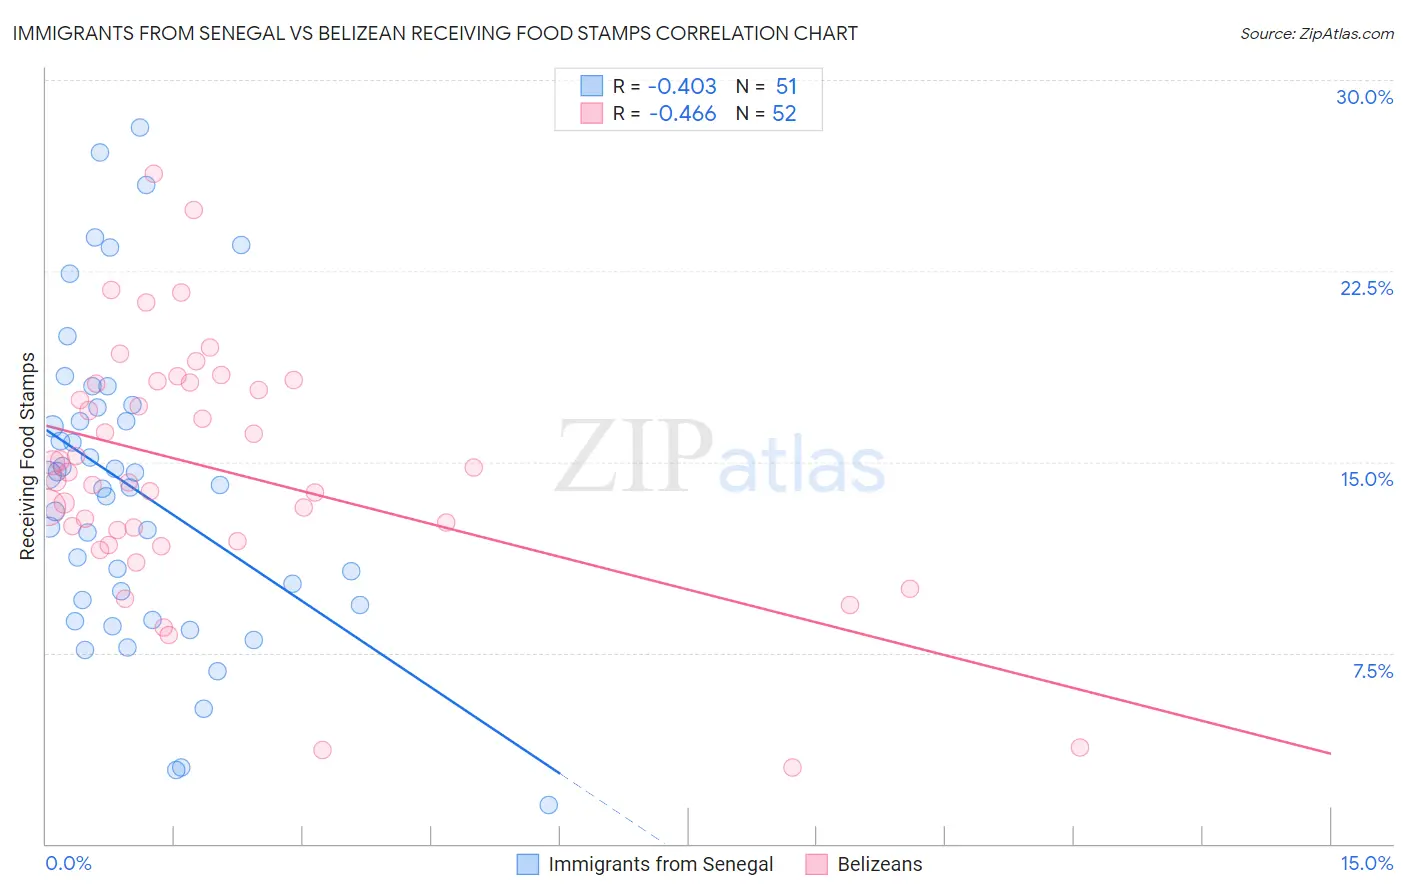
Immigrants from Senegal vs Belizean Receiving Food Stamps Correlation Chart
The statistical analysis conducted on geographies consisting of 90,108,306 people shows a moderate negative correlation between the proportion of Immigrants from Senegal and percentage of population receiving government assistance and/or food stamps in the United States with a correlation coefficient (R) of -0.403 and weighted average of 15.3%. Similarly, the statistical analysis conducted on geographies consisting of 144,020,862 people shows a moderate negative correlation between the proportion of Belizeans and percentage of population receiving government assistance and/or food stamps in the United States with a correlation coefficient (R) of -0.466 and weighted average of 14.8%, a difference of 3.5%.
Receiving Food Stamps Correlation Summary
| Measurement | Immigrants from Senegal | Belizean |
| Minimum | 1.5% | 3.0% |
| Maximum | 28.1% | 26.3% |
| Range | 26.6% | 23.3% |
| Mean | 13.9% | 14.7% |
| Median | 14.0% | 14.4% |
| Interquartile 25% (IQ1) | 9.4% | 12.1% |
| Interquartile 75% (IQ3) | 17.1% | 18.1% |
| Interquartile Range (IQR) | 7.7% | 6.0% |
| Standard Deviation (Sample) | 6.1% | 4.8% |
| Standard Deviation (Population) | 6.0% | 4.7% |
Demographics Similar to Immigrants from Senegal and Belizeans by Receiving Food Stamps
In terms of receiving food stamps, the demographic groups most similar to Immigrants from Senegal are Senegalese (15.4%, a difference of 0.27%), Immigrants from Belize (15.2%, a difference of 0.77%), Immigrants from Mexico (15.2%, a difference of 1.2%), Honduran (15.5%, a difference of 1.3%), and African (15.1%, a difference of 1.5%). Similarly, the demographic groups most similar to Belizeans are Seminole (14.8%, a difference of 0.13%), Liberian (14.8%, a difference of 0.18%), Kiowa (14.9%, a difference of 0.27%), Ecuadorian (14.9%, a difference of 0.32%), and Spanish American Indian (14.9%, a difference of 0.64%).
| Demographics | Rating | Rank | Receiving Food Stamps |
| Alaskan Athabascans | 0.1 /100 | #273 | Tragic 14.7% |
| Immigrants | Western Africa | 0.1 /100 | #274 | Tragic 14.7% |
| Ute | 0.1 /100 | #275 | Tragic 14.7% |
| Liberians | 0.1 /100 | #276 | Tragic 14.8% |
| Seminole | 0.1 /100 | #277 | Tragic 14.8% |
| Belizeans | 0.1 /100 | #278 | Tragic 14.8% |
| Kiowa | 0.0 /100 | #279 | Tragic 14.9% |
| Ecuadorians | 0.0 /100 | #280 | Tragic 14.9% |
| Spanish American Indians | 0.0 /100 | #281 | Tragic 14.9% |
| Immigrants | Central America | 0.0 /100 | #282 | Tragic 15.0% |
| Bangladeshis | 0.0 /100 | #283 | Tragic 15.0% |
| Immigrants | Ecuador | 0.0 /100 | #284 | Tragic 15.0% |
| Immigrants | Liberia | 0.0 /100 | #285 | Tragic 15.1% |
| Africans | 0.0 /100 | #286 | Tragic 15.1% |
| Immigrants | Mexico | 0.0 /100 | #287 | Tragic 15.2% |
| Immigrants | Belize | 0.0 /100 | #288 | Tragic 15.2% |
| Immigrants | Senegal | 0.0 /100 | #289 | Tragic 15.3% |
| Senegalese | 0.0 /100 | #290 | Tragic 15.4% |
| Hondurans | 0.0 /100 | #291 | Tragic 15.5% |
| Alaska Natives | 0.0 /100 | #292 | Tragic 15.6% |
| Vietnamese | 0.0 /100 | #293 | Tragic 15.7% |